
 Pearl
Pearl Bitcoin
 NEAR Protocol
 Starknet
 Solana
 Quant
Quant Ondo
Ondo
- The MA stock price faced resistance from the $401.67 immediate resistance level.
- It has given a breakout of the bullish pennant pattern.
Mastercard Inc. (NYSE: MA) is a technology firm that provides electronic payment solutions to customers across all countries. It is the second-largest payments network in the world. The company processes electronic payment services for consumers, merchants, businesses, financial institutions, etc.
Mastercard Inc.’s Recent Financials and Stock Actions
Annually, this technology firm has performed well compared to the last few years. In 2022, the company reported its annual revenue as $22.24 Billion, which is 17.76% more than the year 2021.
According to the quarterly balance sheet of the firm, it holds a total asset value of $39.00 Billion, increased by 7.65% compared to June 2021. On the other hand, the MA stock price has surged almost 10% in the current quarter.
The stock price has set a yearly target of $451.00 with $418.6/$276.87 as the 52-week high/low. The firm has forwarded the annualized dividend of $2.28 while the current yield is at 0.57%.
MA stock holds a total market capitalization of $378,960,948,406 with an average volume of 3,666,439.
Technical Analysis and Price Prediction of the MA Stock
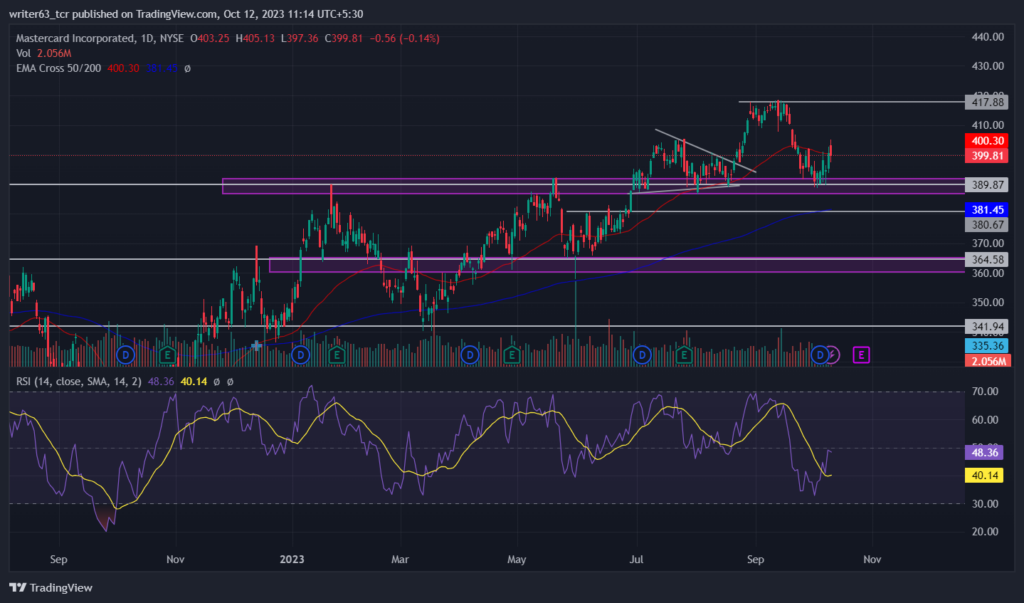
The price has been in an uptrend since October 2022. Recently, the price faced resistance from the 50-day EMA. In the wider outlook of the chart, it is performing above the 200-day EMA. At present, the 50-day EMA and the 200-day EMA are at $400.30 and $381.45 level, respectively.
The MA stock price is currently trading at $399.81 after taking support from the $389.87 important level. In the daily timeframe, it has formed a bearish candle at the $401.67 immediate resistance level reflecting the sellers’ presence. Yet, the price has consistently been driven by the bulls, so it may continue the uptrend.
However, the Relative strength index (RSI) shows strong momentum in favor of the bears indicating the selling pressure from the swing high level. The RSI is sloping above the signal at 48.36 toward the 50-mark middle band.
Conclusion
Technically, the MA stock price is trading in a bullish price structure. So, the price prediction will be bullish. It has taken support from the $389.87 major level and is trading near the immediate resistance at $401.67. The MA stock price may move toward the $417.88 resistance level. If it gives a breakout of this resistance, it may be seen as achieving, the one-year target price of $451.00.
Technical Levels
- Resistance levels: $401.67 and $417.88
- Support levels: $389.87 and $364.55
Disclaimer
The views and opinions stated by the author, or any person named in this article, are for informational purposes only. They do not establish financial, investment, or any other advice. Investing in or trading crypto and stocks comes with the risk of financial loss.




