
 Minter
 Quack AI
 STONK
STONK Pons
Pons Sui
Sui Pearl
Pearl Bittensor
- The EBAY stock has been trading in a tight range for more than 6 months.
- eBay Inc. has witnessed huge selling pressure in its stock.
eBay Inc. is a retail trade company founded in 1995 by Pierre Omidyar. It generally operates in the E-commerce sector. The company has its headquarters in San Jose, California. It has more than 11K employees and the current CEO of the company is Jamie Lannone.
The current highest shareholder of eBay Inc. is its founder Pierre Omidyar. Other institutions hold a large number of shares of the company. More than 91.00% of the shares are held by other institutions. The EBAY stock has 532.157M shares floating in the market available for trading.
eBay Inc. earns the largest revenue from the United States, contributing 49.43% of the revenue and the second largest source of revenue comes from the United Kingdom. It paid a dividend of 0.25 USD on each share on 31st August 2023. The company yields a dividend of 2.12% in 2022, showing consistent advances throughout the years. The current debt/equity ratio of the company is 175.57%.
eBay Inc. Stock Performance Analysis
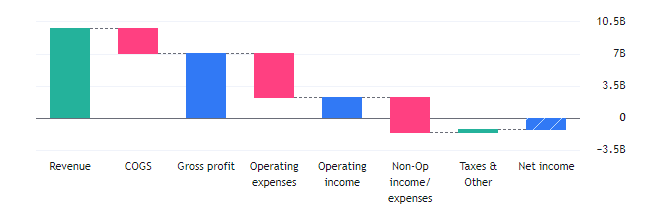
The eBay Inc. company has reported a debt of $9.43B and has managed its debt to stay constant throughout the years. Also, it has a free cash flow of $1.80B, following Cash & equivalents of $2.19B. It made a gross profit of $6.98B in the year 2022, resulting in a negative net income of -$1.269B. Despite these financials, the company has performed well in the recent Q2 reports.
Performance Analysis of EBAY Stock
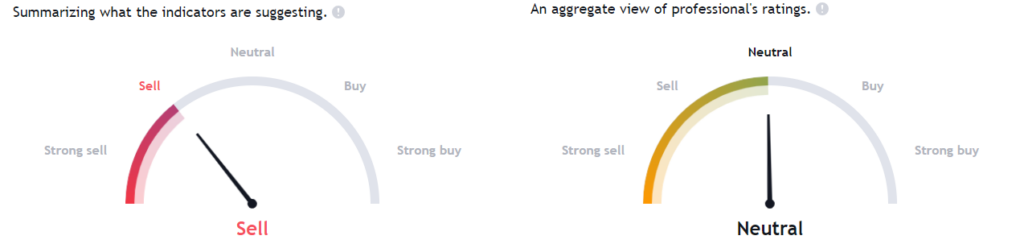
The technicals for the EBAY stock are bearish as the share price has declined from higher levels while the experts are neutral on the share price. There are a few optimistic traders, who are aiming for higher targets of $60.00 in the stock. Also, the least expected price the EBAY stock can achieve is 21.00% below the current market price.
On Brekaout, How Will eBay Inc. Stock React Towards The Market?
a by writer11_gsm on TradingView.com
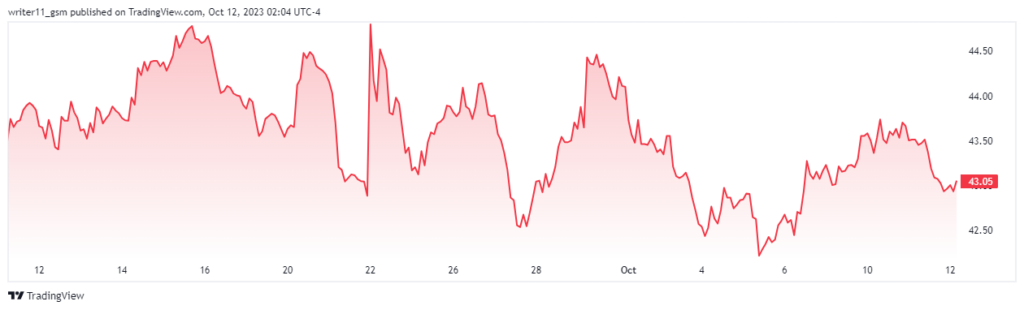
The EBAY stock price after declining from the higher levels has started to consolidate in a tight range. It has spent more than six months in the zone and also gave a fake breakout once. The share price is still trading in the range, making equal highs and lows and resulting in volatility. It indicates that both the buyers and the sellers are fighting with each other but none of them is able to dominate over the price.
The 50-day and the 200-day EMAs indicate a death cross on the daily chart of EBAY stock. It represents that the current market scenario is mildly dominated by the sellers.
The RSI for the stock is totally volatile and uncertain, trading in a very small range on the daily chart of eBay Inc. The current behavior of the RSI represents the lack of momentum in the stock in either direction.
Conclusion
The company is showing some improvements in its financials and also has very good debt management. The analysts are neutral on the stock while the technical indicators such as EMAs and RSI are showing weakness. Its current market structure is uncertain as it is trading inside a consolidation zone.
Therefore, the probability for the stock to break down below the consolidation is high. Investors must wait for the market to break in either direction. If it breaks down, then it can lead to a very good decline in the share price. The breakout in the upper direction can result in a volatile move.
Technical Levels
- Support levels- $38.00 and $40.00
- Resistance levels- $49.00 and $51.70
Disclaimer
The information provided in this article, including the views and opinions expressed by the author or any individuals mentioned, is intended for informational purposes only. It is important to note that the article does not provide financial or investment advice. Investing or trading in cryptocurrency assets carries inherent risks and can result in financial loss.




