
 streamoors
 IGNITION
 Injective
 Quantus
 NEAR Protocol
 Pearl
Pearl LayerZero
- As of October 12, 2023, the SNAP stock’s market capitalization was $14.78 billion. It is now available for $9.11 on the market.
- There were more than 5 million Snapchat users as of September 2023.
- Let us analyze the SNAP stock price and use technical analysis to learn about the stock.
The SNAP Company’s weak fundamentals may steer the investors away. In 2022, the company’s Net Loss increased by $941.70 million from the year before to $1.43 billion. In 2022, the company’s profit increased from the previous year to $4.60 billion. It increased by $484.80 million in 2022. Additionally, its Operating Loss for 2022 increased by $693.24 million from the prior year to $1.40 billion.
Over the course of its history, the SNAP stock has decreased by more than 62.04%, demonstrating the SNAP’s consistently poor performance. The previous year, it fell at a rate close to 11.55%. Financially speaking, SNAP is not doing well, especially as compared to the prior year. September 16, 2011, saw the founding of SNAP. An American Social and Camera company founded by Bobby Murphy and Evan Spiegel.
Live Chart of SNAP Inc.
Technical Analysis of SNAP Stock
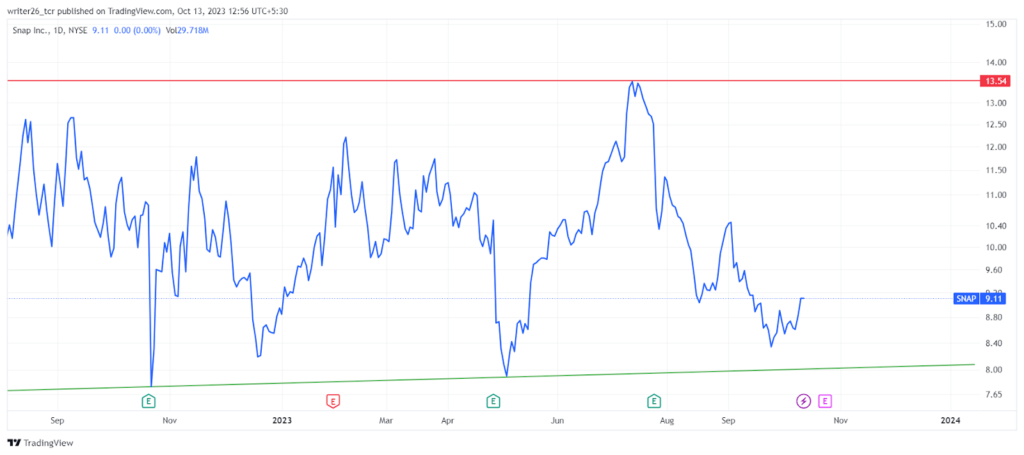
The line chart shows that the SNAP stock is situated between two levels of support and resistance. Since September 2022, it has been acting in the same manner. Even once, the stock is unable to overcome the resistance or support level. Because there have been several point formations that are functioning powerfully on both levels. The price of the 5-D share rose by 6.30%. Over the previous month, it had dropped by 2.67%. It has fallen by 14.62% compared to the 2023 first half of the year.
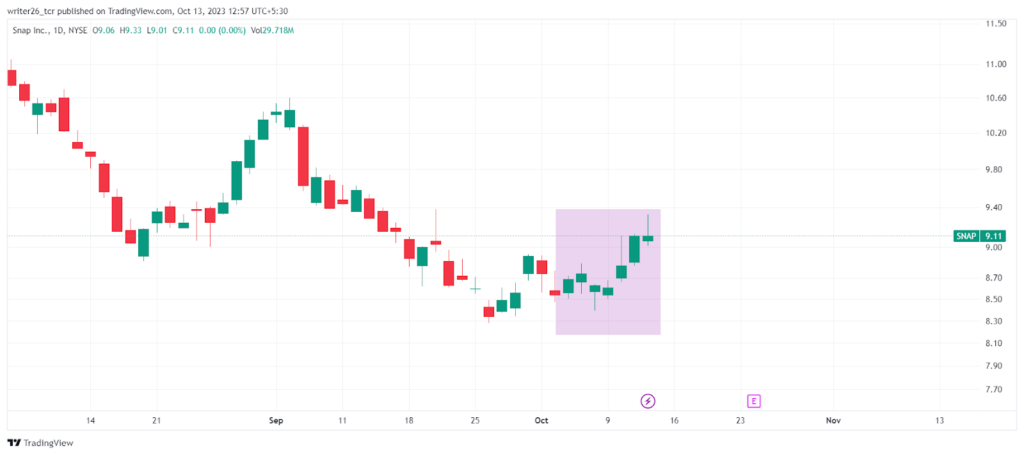
Recent trading days saw the bull run continue to rise. The green candles indicate that the price will shortly start to trend higher. From $8.40 to $9.33 was the price increase over the previous seven trading days. In the monthly time frame, the stock is moving down. The bull rally began on 4 October and continues till today.
Experts predict that by 18 October 2023, the stock might rise to $9.32. This incline of 2.35% in the stock is considered to be quite significant. There may be bulls around, according to the reports. Fear has a reading of 39 on the F&I Index. Its price has changed at a rate of roughly 6.51% over the last 30 days.
SMA and EMA (50,100,200)
Simple Moving Average
The SMA 100- $10.32 (Sell)
The SMA 200- $10.23 (Sell)
Exponential Moving Average
The EMA 100- $9.88 (Sell)
The EMA 200- $11.13 (Sell)
Conclusion
Based on both technical and fundamental analysis, SNAP stock appears to have weak fundamentals and might not be a worthwhile investment for a shorter-term period. It might continue to be in a range for some more time until any breakout is given by the stock in the future.
Technical Levels
Support level- $8.53
Resistance level- $13.54
Disclaimer
This is a general article that does not provide any financial information. Investors should focus on both technical analysis as well as fundamental analysis. The analysis is done to provide information to readers. To make them aware of investments. All the data is fluctuating due to stock market hours. It might change when readers read the article.



