
 no crying in the casino
 Pyth Network
 NEAR Protocol
 Starknet
 Quantus
 Pearl
Pearl Bitcoin
- The current market price of the stock is at $4.00.
- The LL company has been recently offered $180 Million for the merger.
LL Flooring Holdings, Inc. (NYSE: LL) is a hard-surface flooring retailer. It deals in the sale of its products, which are hard-surface flooring, hard-surface enhancement, and accessories.
$180 Million Merger Offer to LL Flooring
On 13 October 2023, the U.S. investment firm Live Ventures offered to buy LL Flooring Inc. for $180 million in cash. In response to the merger offer, LL Flooring said they would review and consider the Live Venture Proposal carefully.
If the deal is accepted, with Live Venture’s experience and support the LL Flooring stock may stop its price from further decline. It would be good for the company to merge with a well-capitalized organization in the ever-changing market conditions.
LL Flooring Inc. (LL) Stock Analysis
The LL stock’s current market share price is $4.00. It has gained 4.26% in its last intraday session and has traded with a volume of 25.333 Million.
1-Day Chart Analysis of the LL Stock
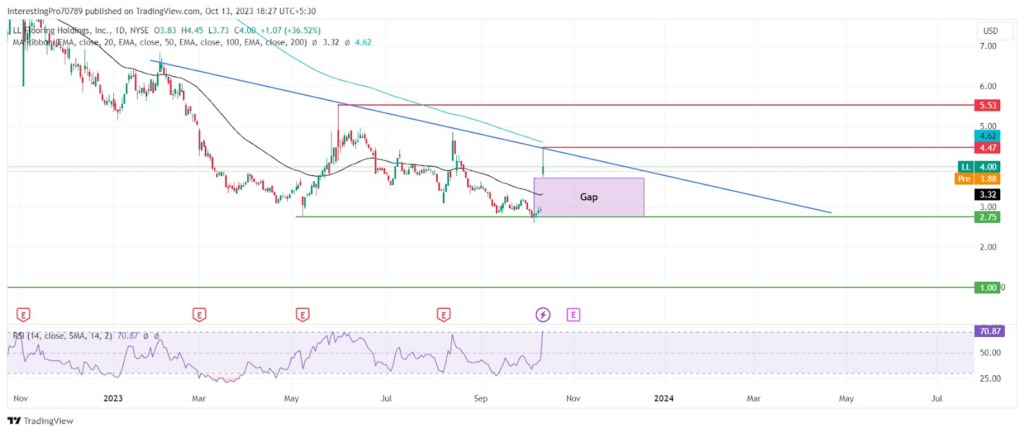
In the last trading session, the LL share’s price experienced a gap-up scenario. It was up by 30% in the morning trading session. On the same day, the price tried to give the breakout of the descending trendline, which was stopping it from rising. It faced rejection from there, started to fall, and formed a shooting star candle. It has a strong support level of $2.75.
The price not only faced rejection from the descending trendline but also from the 200-day EMA. It is currently declining and can fall to test the 50-day EMA. The price is currently trading between the 50 and 200 EMA lines, showing its indecisive behavior.
The relative strength index is at 70.87 and trending in the upward direction. There is no more for buyers left to make the price rise. The RSI is heading towards the overbought territory and the price may start falling after that.
The technical indicators are pointing towards the fall in price in upcoming trading sessions. The price is facing rejection from the 200-day EMA and descending trendline. It can fill the gap in the upcoming trading session and could take support from the $2.75 level.
Suppose the price falls from here and gives the breakdown of the $2.75 level. It may then reach its next support at $1.00.
For the price to be in bullish sentiment, it must give the breakout of the descending trendline. After which it would rise to its resistance at $4.47. If it also gives the breakout of the $4.47 level, it may rise to its next resistance at $5.53.
Conclusion
The overall trend of the LL stock price is bearish. It faces constant rejection from the descending trendline and is forming a higher low formation. It shows the sellers’ domination is greater than the buyers. In the current scenario, there is a gap left which needs to be filled. As the price is falling it may fill the gap in upcoming trading sessions. If it gives the breakdown of the $2.75 support while falling, it may fall to its next support at $1.00.
However, for the price to commence a bull rally, it should close above the trendline. It would rise to its resistance at the $4.47 level. If it also gives the breakout of the $4.47 level, it may rise to its next resistance at $5.53.
Technical levels
Resistance Levels: $4.47 and $5.53.
Support Levels: $2.75 and $1.00.
Disclaimer
The views and opinions stated by the author or any other person named in this article are for informational purposes only. They do not provide financial, investment, or other advice. Investing or trading comes with a risk of financial loss.



