
 Boomer
 hi
hi Claudia
 Covenant x402
 Pearl
Pearl Quantus
 Bitcoin
- The Merck and Co., Inc. has a dividend payout of 237% and a dividend yield of 2.81%.
- The Merck and Co., Inc.’s quarterly profit margin has shown a huge decline.
- Merck and Co., Inc. stock has given a return of 10% in a year.
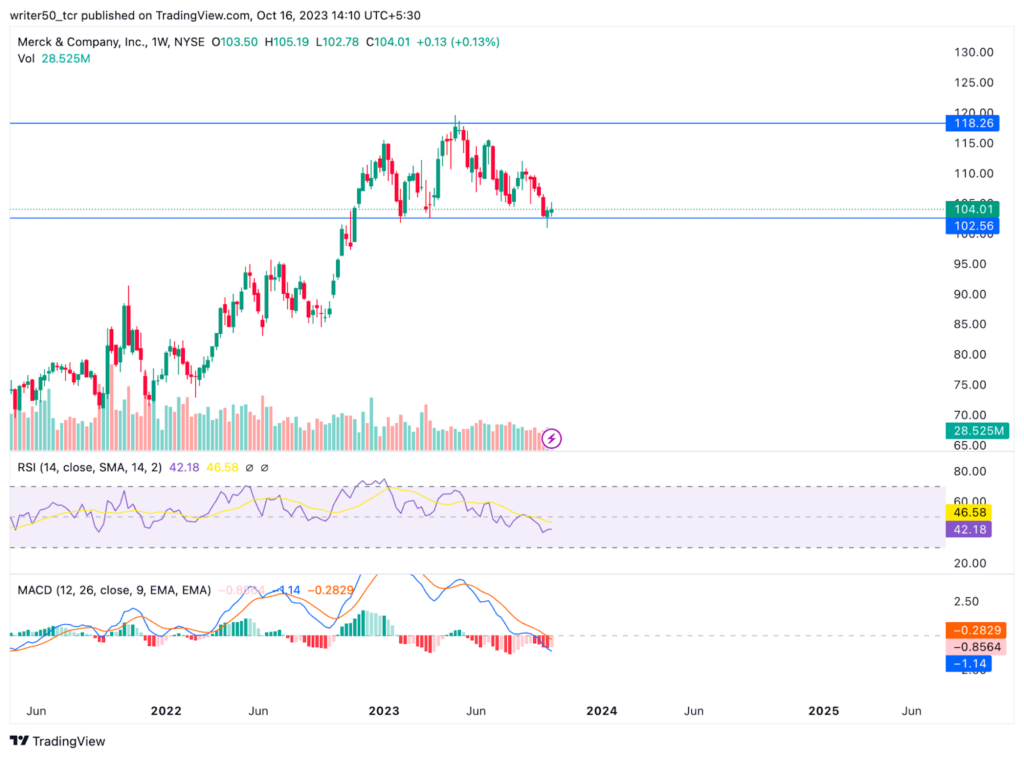
Merck and Co., Inc. (NYSE: MRK) stock currently exhibits a strong downtrend, characterized by the formation of lower lows.
The current trading value of MRK stock stands at $104.01, reflecting a substantial increase of over 0.4% in today’s market session.
MRK stock reached its peak at $119.65 in May 2023, after which it began a decline of nearly -15%. However, the price discovered support at the $102 level and is currently trading close to it. Should the price breach this support level, a further decline may be anticipated.
Over the past year, MRK stock has experienced approximately -10% growth, indicating a period of underperformance by the stock. This might become bad news for the stock price.
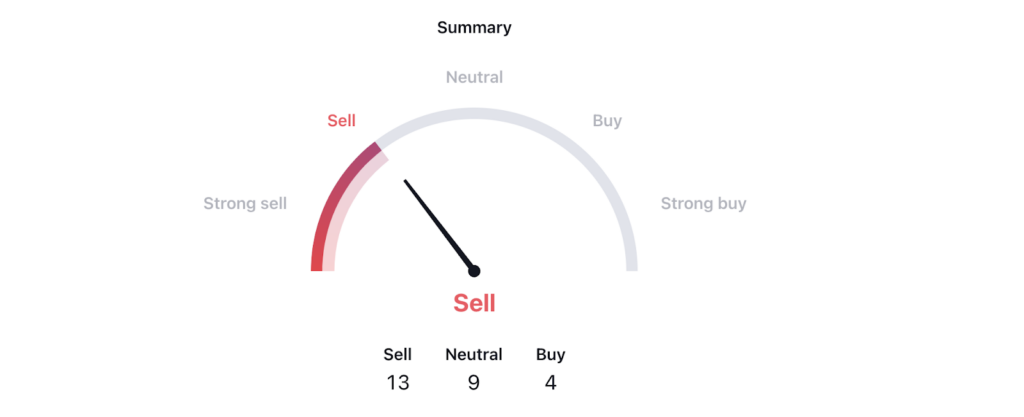
The technical indicators summary also gives a ‘sell’ signal for MRK stock. Out of 26 top indicators, the majority of them point towards a bearish trend.
Additionally, the stock has a dividend payout of 237% and a dividend yield of 2.8%. The payout of 237% indicates that the company is burning its free cash flow and earnings in paying dividends, which might impact the company in the long term.
Merck and Company Inc. (MRK) Stock Price Analysis
Technical Indicators Summary:
At present, the RSI line and the SMA line for MRK stock are both situated around the 40 level, which is bearish territory. This implies the potential for a downward movement in the stock’s price in the near future.
Additionally, the MACD line for MRK stock has formed a bearish crossover, with the signal line above the MACD line. This development is a bearish signal, suggesting the possibility of the stock’s price reaching new lows in the coming days.
Conclusion
Based on the analysis, the stock price of MRK is moving downward. The price has shown a decline after hitting the high. Additionally, the stock has given a negative return in the previous month and the earnings of the company are declining. Hence, considering these factors together, it can be predicted that the price may fall in the future.
Technical Levels
· Support Level: $102
· Resistance Level: $118
Disclaimer
The views and opinions of the author, or anyone named in this article, are for informational purposes only. They do not offer financial, investment, or other advice. Investing or trading crypto assets involves the risk of financial loss.




