
 Covenant x402
 hi
hi Pearl
Pearl Pons
Pons Claudia
 Bitcoin
 Injective
- The Revolution Medicines Inc. stock has shown a rise of over 23% in today’s market session, showing signs of bullishness.
- The Revolution Medicines Inc.’s MACD line is forming a positive crossover.
- Revolution Medicines Inc. stock has given a 55% return in the previous year.
Revolution Medicines, Inc. (NASDAQ: RVMD) is a company in the clinical-stage precision oncology field, with a primary focus on the development of innovative targeted therapies.
Revolution Medicines Inc. stock is currently showing signs of strong uptrend momentum, with the price moving inside a positive chart pattern.
Financial Data of Revolution Medicines Inc. (RVMD) Stock
The current trading value of RVMD stock stands at $29.91, reflecting a substantial increase of over 23% in today’s market session. This surge indicates a notable bullish momentum in the stock’s price. The company has a share float of 92 million shares and an average trading volume of 4 million.
Revolution Medicines has demonstrated remarkable growth of approximately 55% over the past year, signifying strong past performance that might attract potential buyers.
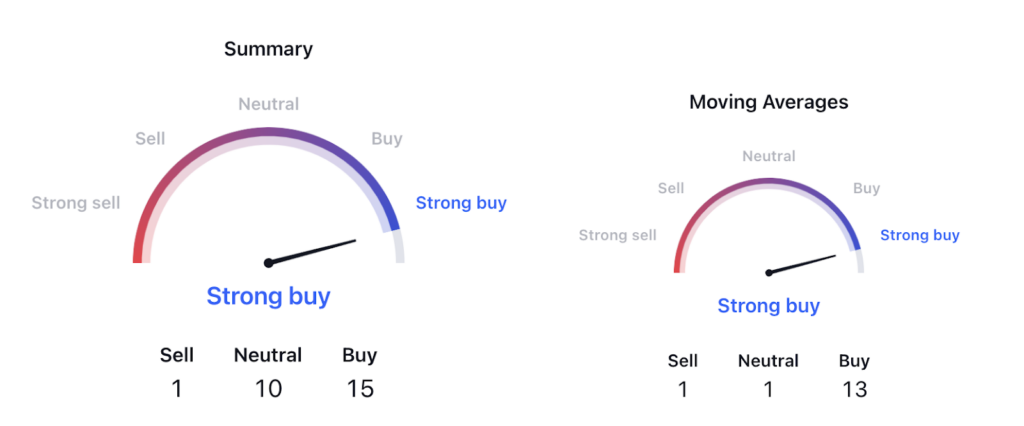
Furthermore, the technical indicator summary suggests a ‘strong buy’ signal for the stock, with the moving averages also indicating a bullish outlook. Analysts have set a target price of around $36.7 for RVMD stock in the coming period, which represents a 2.7% increase from the current price. Positive expert reviews further enhance the positive sentiment around the stock.
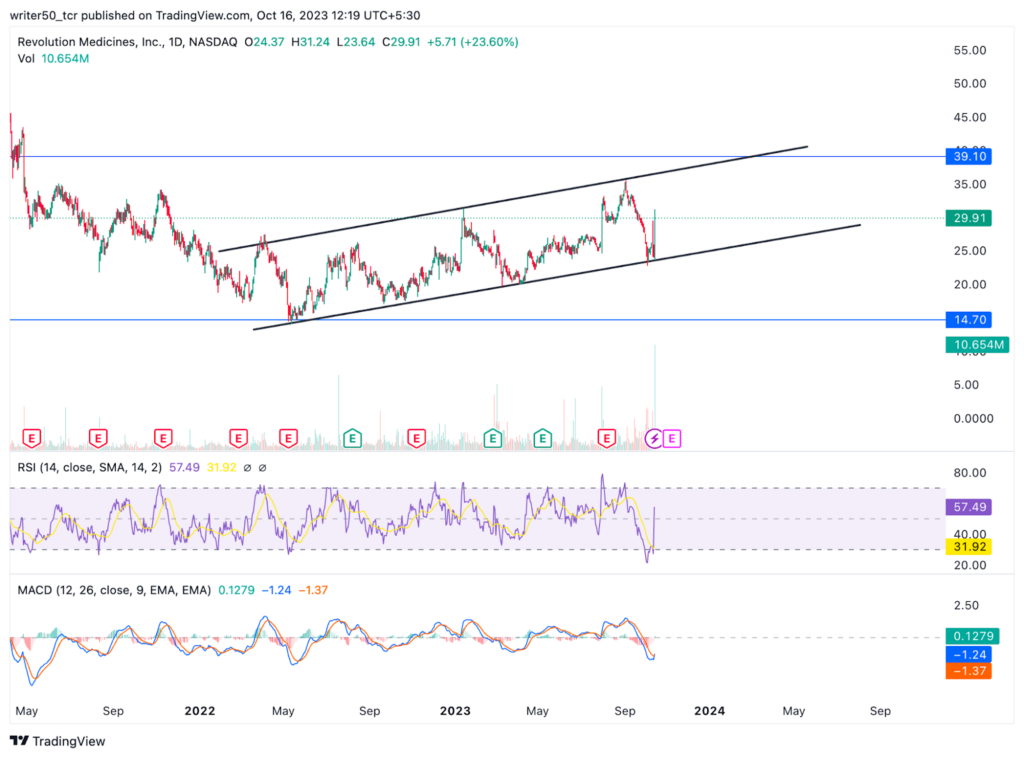
The RVMD stock price is currently following an upward parallel channel pattern, which is considered a favorable sign. This pattern indicates that the price is likely to move above the channel in the near future, reflecting the overall positive structure of the stock.
Revolution Medicines Inc. (RVMD) Stock Price Analysis
Technical Indicators Summary:
Currently, the RSI line and the SMA line for RVMD stock are positioned near the 60 level, which is considered a positive region. This hints at a potential upward movement in the stock’s price in the coming days.
Moreover, the MACD line for RVMD stock has initiated a positive crossover, with the signal line trading the MACD line. This is a favorable signal, indicating the potential for the stock price to reach new highs in the upcoming days.
RVMD Chart By TradingView.com
Conclusion
Based on the analysis, the stock price of Revolution Medicines Inc. is currently following an upward trend within a parallel channel pattern. The stock has also delivered a positive return in the past year, and coupled with favorable signals from analysts, it is anticipated that the price of RVMD will continue to rise in the future.
Technical Levels
- Support Level: $24
- Resistance Level: $6
Disclaimer
The views and opinions of the author, or anyone named in this article, are for informational purposes only. They do not offer financial, investment, or other advice. Investing or trading crypto assets involves the risk of financial loss.




