
 Boomer
 hi
hi Claudia
 Covenant x402
 Quantus
 Pearl
Pearl NEAR Protocol
- The OXIG stock price has fallen by more than 25% since the breakdown of the ascending channel pattern.
- The trading oscillator shows some divergence after it reaches near the demand zone.
Oxford Instruments Plc (LON: OXIG) is a manufacturing and research company headquartered in Abingdon, United Kingdom. It designs and manufactures tools and systems for industry and research. The company engages in the research, manufacture, development, and sale of high-technology instruments.
Price Action and Financials of OXIG Stock
As per the cash and short-term investments of the company, the value has increased up to 16.91% in comparison with the previous year. It holds total assets worth £572.00 Million, which reflects an increase of 11.28%, along with total liabilities at £228.00 Million.
In the first quarter, the firm reported its net revenue as £122.10 Million which has increased by 23.83% compared to March 2022. Subsequently, the stock price surged by 14% to the £2880 resistance level which reflected the interest of the investors.
However, in the middle of the second quarter, the OXIG stock price fell more than 33%, because, in the wider outlook of the chart, this resistance met the supply level at which the bears got active.
The stock has a price-to-earnings (P/E) ratio of 21.88 while the earnings-per-share (EPS) has grown by 3.09%. It holds a total market capitalization of £1.11 Billion with an average volume of 118.48K.
Stock Technicals and the Price Prediction
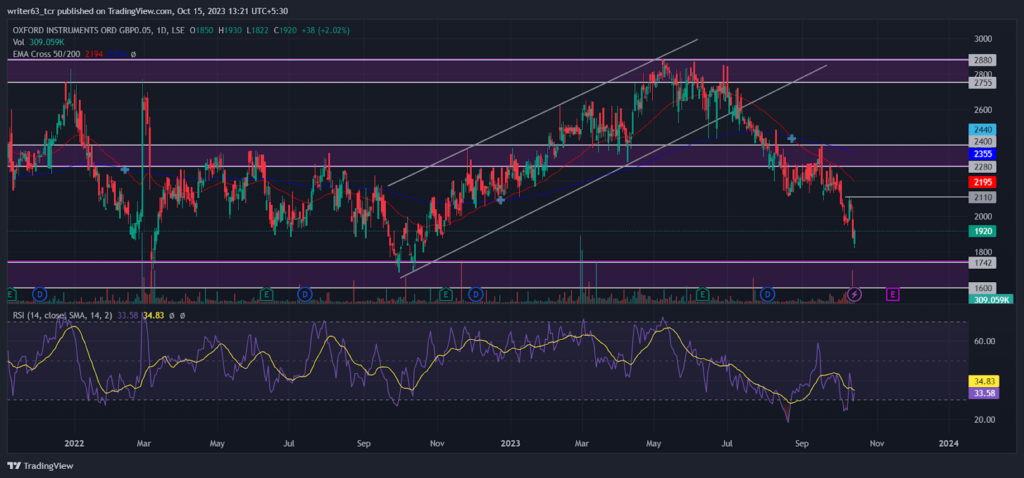
The stock price has been in a downtrend since it gave a breakdown of the ascending channel pattern. In August 2023, the bearish crossover between the 50-day EMA and the 200-day EMA confirmed the bearish sentiments for the OXIG stock price. At present, the 50-day EMA is at the level of £2195 while the 200-day EMA is at £2355.
At press time, OXIG stock is trading at £1920, near the important demand zone between £1742 and £1600. It is moving toward the bulls’ area of interest. In the last trading session, it formed a green bullish candle which basically reflects the early entry of the buyers. Overall, the OXIG stock price will retest the demand zone, and then it may show potential for reversal.
Furthermore, the relative strength index (RSI) has already shown a bullish divergence. This indicates that the bulls have dominated the price momentum currently. However, this could be a liquidity trap for the early aspirants.
Conclusion
The OXIG stock price has been in a downtrend after the breakdown of the ascending channel pattern. The price prediction will be bullish after it reaches the demand area at the £1742 level. Currently, the price is generating some liquidity near the support level. After taking liquidity, it may probably show some potential signs of a bullish rally.
Technical Levels
- Resistance Levels: £2400 and £2880
- Support Levels: £1600
Disclaimer
The views and opinions stated by the author, or any person named in this article, are for informational purposes only. They do not establish financial, investment, or any other advice. Investing in or trading stocks comes with the risk of financial loss.




