
 Quack AI
 Pearl
Pearl Solana
 NEAR Protocol
 Canton
 XRP
XRP Derive
- Dollar General stock has been rated ‘Equal-Weight” by the rating firm Barclays.
- Dollar General Stock is trading below the 50-day and 200-day Exponential Moving Averages.
- This stock is down by over 55% from the year’s high level.
The Dollar General Corporation stock is currently in a strong bearish trend as it has fallen by over 55% from this year’s highs. It is trading at a Multi-Year low level, as the stock price is trading very close to the low of year 2019. However, the stock has jumped by over 9% in the last trading session. This surge in the stock happened due to the news that Todd Vasos has returned as the CEO of the Dollar General company.
Dollar General stock started this downfall in the month of November last year. The CEO Todd Vasos resigned from the post at that time. It is considered to be a major reason for this massive fall in the stock. However, as soon as the news started to circulate this impacted the stock positively and it jumped massively. It will be interesting to see whether the stock reclaims its lost glory again.
The Rating firm, Barclays has rated the Dollar General stock with a rating of Equal Weight. It has cut down the target price of the stock from $128 to $124. Several other Rating Firms set the target in this range only which is a positive sign for the company. The stock is more than 10% away from these targets, and it can try to achieve the target in the near time.
An Abstract from the Dollar General Stock Chart
It is clearly visible on the chart that the DG stock is currently in a strong bearish grip. The buyers will have to face a lot more difficulties to escape this grip. During its downtrend, the stock has created several gaps on the daily chart, which are yet to be filled. These gaps will act as a resistance to the price. Apart from this, $120.50, $138.35, $149.90 and $171.07 levels will act as resistance to the stock price.
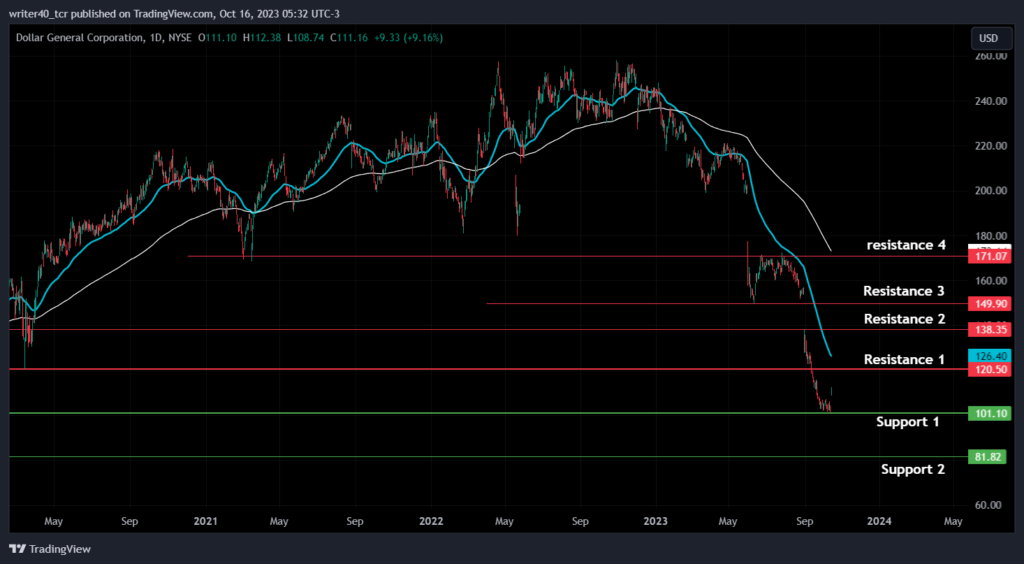
The DG stock price is far away from the 50-day and 200-day Exponential Moving Average. It has witnessed a death cross in the month of February 2023. The stock price has reacted sharply as it has fallen down with some giant bearish candles. $101.10 and $81.82 will act as support for the stock price, they are marked in green on the chart.
Basic review of the Bollinger Band and Relative Strength Index
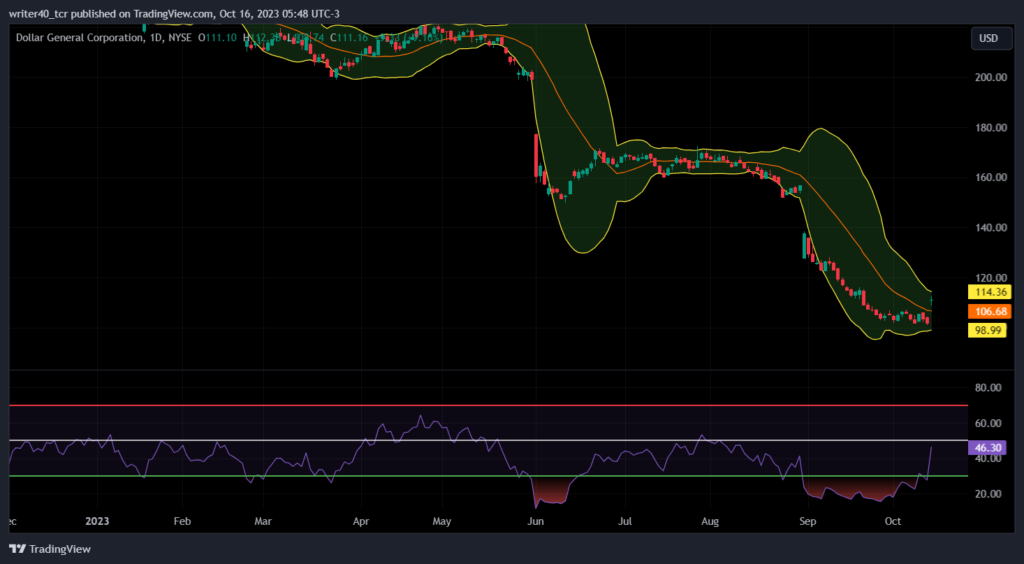
The Bollinger Band is closing and it is a sign that the stock can witness some less volatile move ahead. DG stock price can face some hurdles near the level of $114.36 on the upside and $98.99 on the downside. The Relative Strength Index was in an oversold trajectory for the past 1 month and recently escaped from this. Right now, the stock has gained a strong momentum as the curve of the RSI has risen sharply.
Conclusion
The DG stock price has shown a great jump from the base, as it has been flat for more than 13 trading days. If the stock price continues to rise from here, it can go towards the level of $120.50 and $138.35. However, a breakdown from the level of $101.10 can make the price go towards the level of $81.82.
Technical Level
Resistance – $120.50 and $138.35
Support – $101.10 and $81.82
Disclaimer
The views and opinions stated by the author, or any people named in this article, are for informational purposes only. They do not establish financial, investment, or other advice. Investing in or trading crypto assets comes with a risk of financial loss.




