
 Minter
 Pearl
Pearl NEAR Protocol
 Pons
Pons Quack AI
 Quantus
 Sui
Sui
- The VISA Stock has been rated with a “BUY” by Goldman Sachs.
- V stock’s price has surged by over 35% in a year.
- Visa company delivered remarkable growth in its net Income over the past few years.
The VISA stock price has been in a strong bullish trend since the listing of the stock. It has witnessed some correction between July 2021 and October 2022. In this period, the stock has corrected for about 30%. However, with remarkable growth in the Financials of the company, the stock has resumed its uptrend. It has risen over 36% from the low it created in the correction phase.
VISA stock is currently in an uptrend in the short-term time horizon. It has been forming a higher highs and higher lows chart formation on the daily chart. This formation confirms that the trend of the stock is bullish. Besides, the stock price is expected to perform well in the future. The stock price surged for 7 days out of the last 8 trading sessions indicating that bulls are in a strong grip over the stock.
VISA stock has been given a “BUY” rating by the rating firm Goldman Sachs. It has raised the target price from $286 to $289 of the stock. It can enhance the trust of the investors on the stock and its price can react positively to this news.
Outlook of the VISA Stock Chart
Visa stock price has formed a rising channel pattern and the coin price has respected this pattern so far. It is trading well above the 200-day Exponential Moving Average but is struggling around the 50-day Exponential Moving Average. The price has exactly reversed from the level of $227.73 and formed a double-bottom pattern. It has witnessed a golden crossover in the month of December 2022 and the price has reacted positively after that.
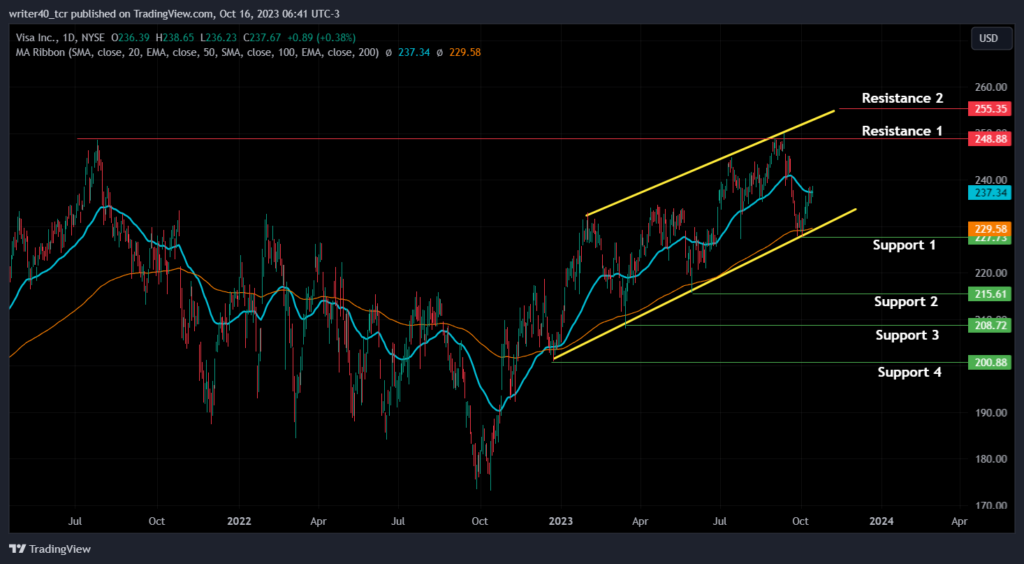
Apart from the Rising Wedge pattern’s resistance and support, the V stock can surely react at some point. $248.88 and $255.35 will act as a strong resistance level for the stock. $227.73, $215.16, $208.72, and $200.88 can act as support for the price.
A closer Look at the indicators
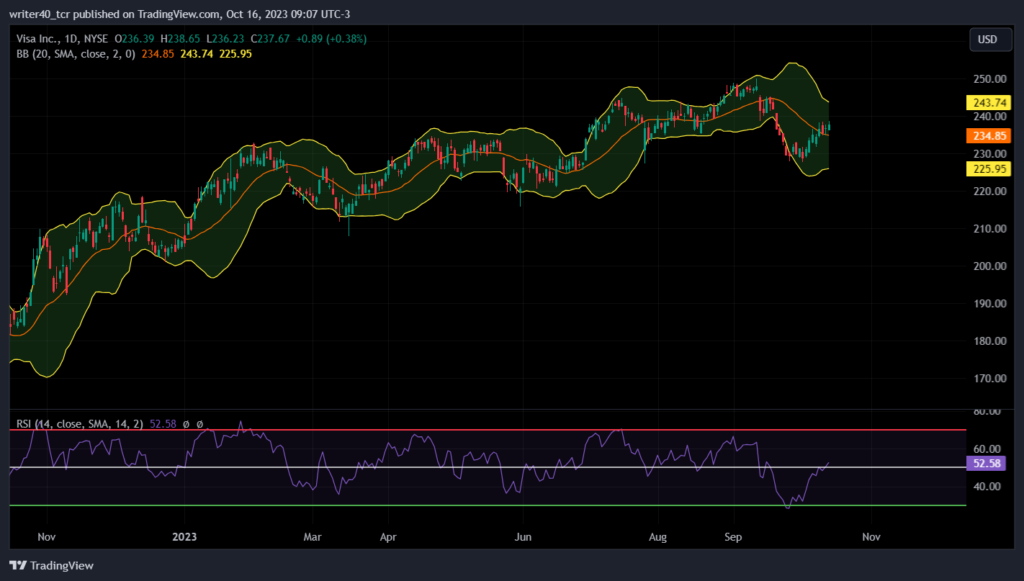
Bollinger Band on the daily chart seems to be closing, which can result in less volatility ahead. The upper band which can provide resistance to the stock is present at the level of $243.74. The lower band which can provide support to the price is present at the level of $225.95. If we consider the Relative Strength Index, it is curving above the 50 level which indicates that the momentum is bullish.
Conclusion
The V stock has been in a strong uptrend and the finances of the company showed remarkable growth over the period of time. However, if the price breaks this rising channel pattern on the downside, the price can try to reach the lower levels mentioned above. On the other hand, if it breaks the upper resistance level of $248.88, it can try to achieve the level of $255.35.
Technical Levels
Resistance – $248.88 and $255.35
Support – $227.73 and $215.61
Disclaimer
The views and opinions stated by the author, or any people named in this article, are for informational purposes only. They do not establish financial, investment, or other advice. Investing in or trading crypto assets comes with a risk of financial loss.




