
 Minter
 Bittensor
 Hyperliquid
 NEAR Protocol
 Monero
 Pearl
Pearl Quantus
- The company’s share price declined by 3.85% in its last intraday session.
- The HG stock chart shows the sellers are currently more active than the buyers.
Hargreaves Lansdown (LSE: HG) is a financial service provider company that gives financial planning and advice. It deals in the sale of funds, shares, and related products to the retail investors.
Hargreaves Lansdown (HG) Stock Analysis
At press time, Hargreaves Lansdown’s stock closed its last intraday session at 739.8 GBX with a decline of 3.85%. The HG stock has a market capitalization worth 3.505 Billion GBP and is a small-cap organization.
1-Day Chart Analysis of Hargreaves Lansdown (HG) Stock
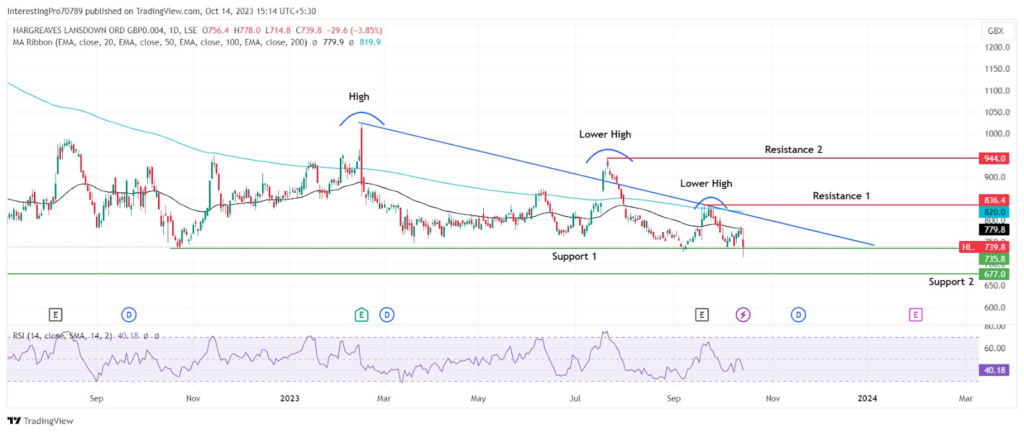
Hargreaves Lansdown’s share price is currently sustaining above 235.8 GBX. With a strong presence of sellers, the price has formed lower highs in the chart. The recent candle that has formed is an indecision candle. It indicates the price is confused to to decide its future trend.
The price was retesting the 50-day EMA constantly but was not able to close above it. In the last intraday session, the price faced rejection. It fell back to its 735.8 GBX level. Moreover, the 50 as well as 200 EMA lines are trading above the price. All these factors show signs of a bear’s strong hold over the price.
The relative strength index line is below 50, which is marked in bearish territory. The RSI line is pointing toward the downside. It shows the high selling pressure is making the RSI slope in a downward direction. In addition, it has more room left on the downside to continue its downward sloping.
The 1-day chart of the HG stock shows that the sellers are more active than the buyers. However, there is strong support for 735.8 GBX. So, traders should wait for the breakdown of the 735.8 GBX to look for the selling opportunities. If the price closes below the 735.8 GBX level, it may continue its fall to its support at 677 GBX.
However, for the price to be in bullish sentiment with a strong control of buyers over the price. It must give the breakout of the trendline and close above the 836.4 GBX. After that, it may rise to its next resistance at 944 GBX.
Conclusion
The overall sentiment of the Hargreaves Lansdown stock is bearish. The sellers are controlling the price in every aspect. In the next few upcoming trading sessions, the price gives the breakdown of the 735.8 GBX. It may fall to its next support at 677 GBX. However, for it to be in bullish sentiment, it must give the breakout of the trendline and also 836.4 GBX. Then only it may rise to its next resistance at 944 GBX without any obstacles.
Technical levels
Resistance Levels: 863.4 GBX and 944 GBX.
Support Levels: 735.8 GBX and 677 GBX.
Disclaimer
The views and opinions stated by the author or any other person named in this article are for informational purposes only. They do not provide financial, investment, or other advice. Investing or trading comes with a risk of financial loss.




