
 Quack AI
 NEAR Protocol
 Monero
 Lighter
 Ethena
 Pons
Pons Sui
Sui
- The OCDO stock price is currently down by 7.24% since its last intraday session.
- The company share price is showing strong selling pressure.
Ocado Group (LSE: OCDO) is a British grocery supplier company. It deals in the operation of the grocery supermarket. The operates through various segments such as Retail, UK solutions & logistics, and International Solutions.
Ocado Group (OCDO) Stock Analysis
The OCDO stock closed its last intraday session at 530.8 GBX with a decline of 7.24%. It is a small-cap organization with a market capitalization of 4.33 Billion GBP. The company stock price trades with a 10-day average volume of 1.806 Million.
1-Day Chart Analysis of OCDO Stock
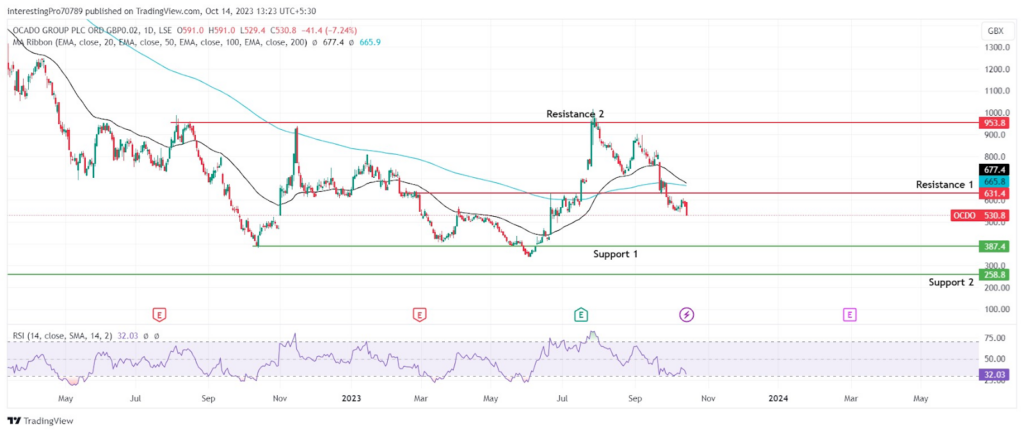
The 1-day chart of OCDO reflects that its price is currently falling after almost retesting the 321.4 GBX. The recent candle formed shows the strong pressure of bears. Ocado stock’s price has declined by 10.28% in the last 3 trading sessions.
The 50 and 200-day EMA lines have started to slope in the downward direction. They are currently trading above the price showing the seller’s pressure over the price. If the price continues to fall, we can see a golden crossover between these two EMA lines. In which the 50-day EMA (black line) will intersect the 200-day EMA (blue line) from the upside to the downside. Suppose that happens, it will confirm the continuation of the downtrend.
The RSI is at 32.03, which is marked as a bearish territory and is sloping in a downward direction. Showing the high selling pressure currently going on.
In the current scenario, if the next candle closes below the current candle red bearish candle, the price may continue its downtrend to 388.8 GBX. If it also breaks below this support level, it may continue its fall to 258.8 GBX.
However, the price must reclaim the 631.4 GBX which is currently acting as a resistance and sustains over it. Thus, it can be in bullish sentiment and rise to its next resistance at 953.8 GBX.
Conclusion
The OCDO stock price prediction is bearish as the EMA lines, RSI, and the last candle show strong selling pressure. If the next candle closes below the current red candle, the price will continue its fall to the support at 387.4 GBX support. For the continuation of the downtrend, the price must give the breakdown of the 387.4 GBX. Thus, it may fall to its next support at 258.8 GBX.
The only way the OCDO stock price may be in bullish sentiment is that it should reclaim 631.4 GBX and have to sustain above it. Then only the stock price may rise to test the $953.8 GBX resistance.
Technical levels
Resistance Levels: 631.4 GBX and 953.8 GBX.
Support Levels: 387.4 GBX and 258.8 GBX.
Disclaimer
The views and opinions stated by the author or any other person named in this article are for informational purposes only. They do not provide financial, investment, or other advice. Investing or trading comes with a risk of financial loss.




