
 Covenant x402
 hi
hi Pearl
Pearl Pons
Pons Claudia
 Bitcoin
 Injective
- The VMW stock price has given a breakout from the cup and handle pattern.
- Price is getting strong support from the 50-day EMA.
VMware, Inc. (NYSE: VMW) is a cloud computing and virtualization technology company headquartered in California, United States. It was the first commercially successful company to virtualize the x86 architecture. It forms a digital foundation that powers the app, services, and experiences that are transforming the world.
Recent Financials and Stock Performance Overview
Overall, the company has been performing pretty decent compared to its previous years. In the current year, the firm has reported its revenue at $13.35 Billion, which increased by 3.88% as per the year-to-year change.
As of August 2023, it has reported its quarterly net income at $477.00 Million with an increase of 34.62% in net profit margin. On the other hand, the VMW stock price has also observed an increase of almost 15% in its value.
The stock price has a one-year target of $165.00 with a 52-week high/low price of $180.36/$103.55. The price-to-earnings (P/E) ratio is high at 53.7 while the earnings-per-share (EPS) is at $3.31.
VMW stock holds a total market capitalization of $76,754,899,387 with an average volume of 1,328,544.
Technical Analysis of the VMW Stock Price
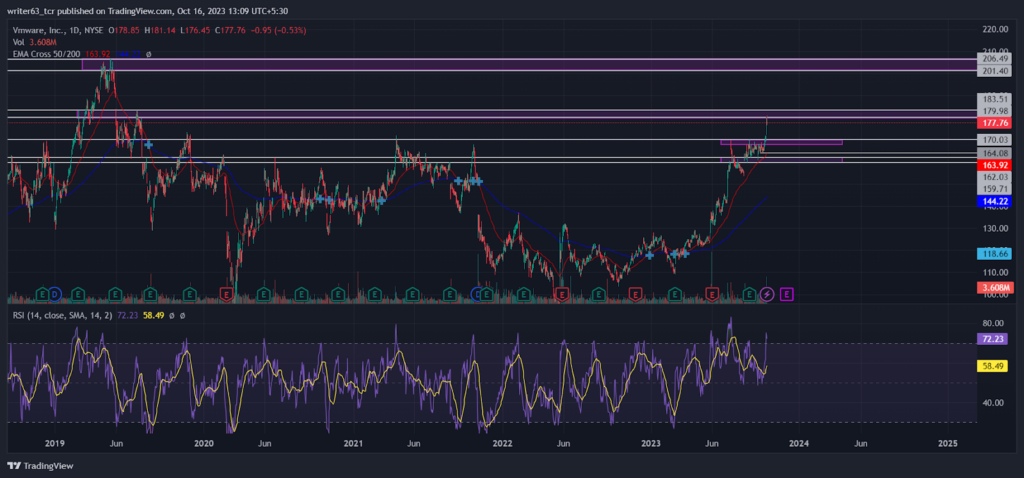
The VMW stock price has been trading in a strong bullish trend since the 50-day EMA made a bullish crossover with the 200-day EMA. After the crossover, the 50-day EMA has become a constant strong support for the stock price. At present, the 50-day EMA is at the level of $163.92 along with the 200-day EMA at $144.22.
At the press time, the VMW price is trading at the $177.76 level after facing resistance from the 179.98 level. Recently, the stock price has given a breakout from the cup and handle pattern. It is leading it toward an all-time-high resistance level.
In the last trading session, the price formed a bearish rejection candle reflecting the activeness of the sellers. However, the price may retest the $170.03 level, it may get the required potential for another bullish rally toward the $201.40 resistance.
Furthermore, the relative strength index (RSI) shows strong bullish momentum, indicating the bulls became super active at the current trading phase. The RSI line is sloping at 72.23 above the upper band at 70-Mark.
Conclusion
Overall, the VMW stock price is trading in a strong uptrend and already achieved its one-year target price of $165.00. Therefore, the price prediction for the stock would be bullish. The price is moving toward an all-time-high level at $206.80. However, it may retest the breakout level at $170.03 before that. It may later get the required potential for another bullish rally toward the $201.40 resistance.
Technical Levels
- Resistance levels: $183.51 and $206.49
- Support levels: $164.08 and $159.71
Disclaimer
The views and opinions stated by the author, or any person named in this article, are for informational purposes only. They do not establish financial, investment, or any other advice. Investing in or trading stocks comes with the risk of financial loss.




