
 Covenant x402
 Doge Pepe
 Tetsuo Super Intelligence
 Claudia
 Boomer
 hi
hi Quantus
- CI price is moving toward the upper resistance of the descending channel.
- Buyers’ got support from the 50-day EMA in the daily chart.
Cigna Group (NYSE: CI) is a for-profit managed healthcare and insurance company headquartered in Connecticut, United States. It ranked #15 in the 2023 Fortune 500 list of the largest U.S. corporations by total revenue. The company offers integrated health plans and services such as medical, dental, disability, life and health insurance, and related products.
Stock and Financial Performance of the Company
According to the annual report, the company has been performing balanced for the past few years. Although, the stock has observed a decline of -5.80% in its price value. It has reported its annual revenue as $180.02 Billion, which has a decent increment of 3.30% compared to the year 2021.
In the second quarter of 2023, the firm experienced a decline of -12.54% in the net profit margin along with -6.23% in net income. However, despite the current negative profitability, it has increased its cash and short-term investments up to 100.06% as per the year-to-year change.
The CI stock price increased by 1.95% after the end of the second quarter. However, in the current quarter, it has observed an upsurge of 9.11% in the price value. Presently, price is moving toward the all-time-high resistance level.
The stock has a one-year target price of $345.00 while the yearly price range is between $340.11 and $240.5. It has forwarded the annualized dividend of $4.92 yet the current yield is at 1.61%.
Technical Analysis of the CI Stock
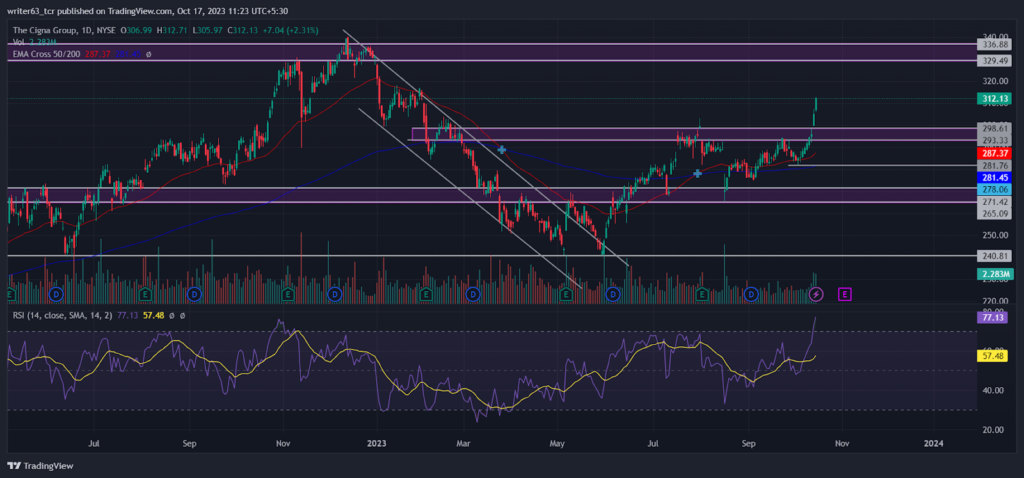
The CI stock price is performing above the 50-day EMA and the 200-day EMA, indicating a bullish trend. Both the EMAs have made a bullish crossover with each other, displaying strong bullish sentiments. At present, it is using 50-day EMA as a strong support for the future boost.
In the wider outlook of the chart, the price has given a breakout from the descending channel. It caused a bullish rally toward the upper resistance of the pattern at $336.88. At press time, CI price is at $312.13 after the breakout of the $298.61 immediate resistance level. According to the price action, it may retest the recent breakout level, it will continue to the immediate resistance at $329.49.
Furthermore, the relative strength index (RSI) is sloping above the signal line at 77.13 in the overbought territory. It reflects the bulls are taking more positions compared to the bears in the current trading phase.
Conclusion
All in all, the CI stock price has been in an uptrend since the breakout of the descending channel. Therefore, the price prediction for the stock will be bullish. At present, price is moving toward the immediate resistance at the $329.49 level. However, to do so, it may first retest the breakout level of $298.61. Subsequently, it may turn toward an all-time high.
Technical Levels
- Resistance levels: $329.49 and $336.88
- Support levels: $293.33 and $281.76
Disclaimer
The views and opinions stated by the author, or any people named in this article, are for informational purposes only. They do not establish financial, investment, or any other advice. Investing in or trading stocks comes with the risk of financial loss.




