
 Quack AI
 NEAR Protocol
 Pudgy Penguins
 Pearl
Pearl Quant
Quant Quantus
 Sui
Sui
- Revolution Medicines soared by 40% in previous trading sessions.
- Needham has given a “BUY” rating for the Revolution Medicines stock.
- Revolution Medicines stock has formed a rising channel pattern on the daily time frame.
Revolution Medicines (NASDAQ: RVMD) stock has shown a great surge in its price. It has soared by over 40% within two days, along with a significant increase in volume. This indicates that some long position has been created in the stock. The stock price has created a W-pattern with this move, which is considered bullish. It has engulfed every single candle of the past month, which is a bullish sign for the upcoming time.
RVMD stock has been in a persistent downtrend since February 2021, experiencing a correction of over 74% during this prolonged decline. This bearish trend continued until May 2022, with buyers facing significant challenges as aggressive sellers dominated the stock, leaving little room for price recovery.
The RVMD stock price changed its bearish structure after May 2022. It formed higher highs and higher lows which confirmed the bullish trend. Recently, the rating firm Needham has rated the stock with a “BUY” rating. It has set the target price of $34 for the stock. The stock has reacted positively and surged by over 40% and achieved almost all the targets suggested by different analysts.
An Outlook of the Revolution Medicines Stock Chart
RVMD stock has declined by about 6% in the last session. It has retracted from the resistance level of $35.61 along with the upper level of the rising channel pattern. Apart from this, the resistance level of the stock is present at $41.52. Considering the support zone, the price can take support at $22.99, $19.69 and $14.33.
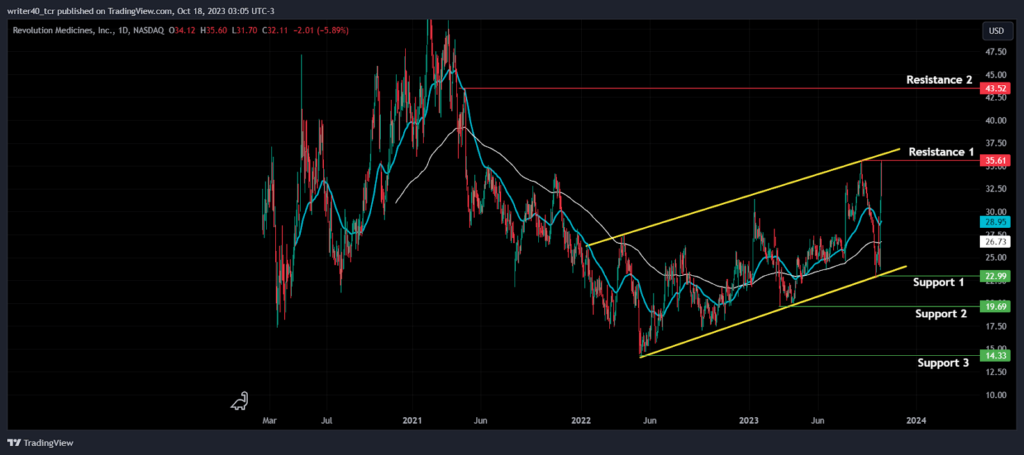
RVMD stock has formed a rising channel pattern and it can also be considered as an inverted Flag and Pole pattern. It has shown a great surge from the bottom of the rising trendline. This shows that the stock price is respecting the pattern and buyers are aggressively present there. If we look closer at the EMAs, then the stock price is moving above the 50-day and 200-day EMAs.
A Short Glimpse of the Indicators:
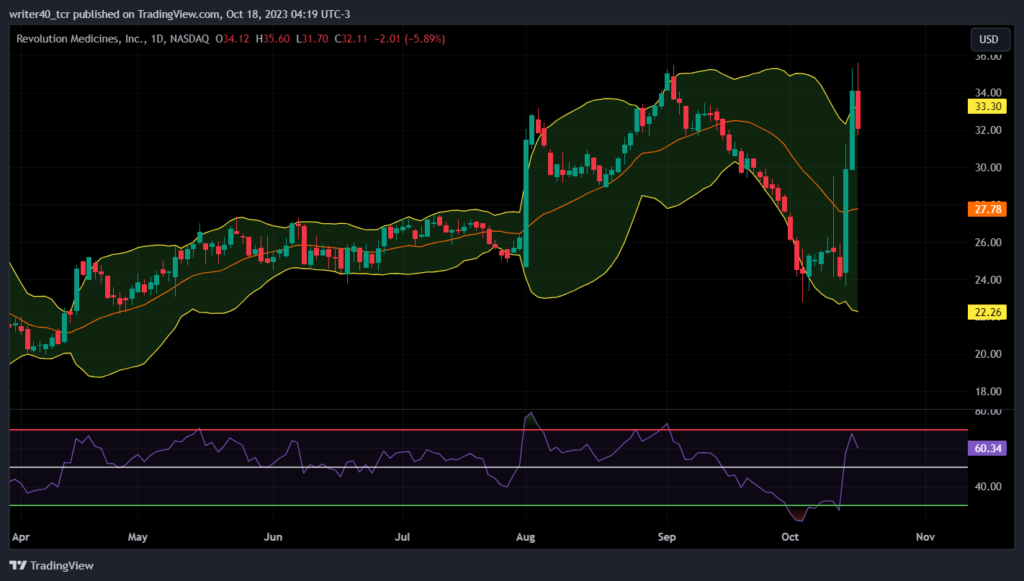
The RVMD stock price recently closed above the upper band of the Bollinger Bands, but in the following trading session, it promptly closed below the band. This suggests that sellers have entered the market, exerting downward pressure on the price. In terms of the relative strength index (RSI), it is currently positioned comfortably above the midpoint, indicating that the indicator is currently favoring the bulls.
Conclusion
The RVMD stock price has shown a huge jump in price and such a jump requires some cool-off period to continue. After some correction, if the price resumes this uptrend, then it can try to break the resistance levels of $35.61 and $43.52. However, if the price starts falling after this, then it can take support from the $22.99 and $19.69 levels.
Technical Level
- Resistance – $35.61 and $43.52
- Support – $22.99 and $19.69
Disclaimer
The views and opinions stated by the author, or any people named in this article, are for informational purposes only. They do not establish financial, investment, or other advice. Investing in or trading crypto assets comes with a risk of financial loss.




