
 Quack AI
 Pearl
Pearl Solana
 NEAR Protocol
 Canton
 XRP
XRP Derive
- Glencore Stock price has been consolidating since March 2023.
- GLEN Stock has declined by over 6% in one year.
- Glencore company’s net revenue has declined by over 60.27% in the latest half-yearly result.
Glencore stock has been trading in a sideways trend since March 2023. However, the stock was initially moving in an uptrend since March 2020. It surged by over 489% from March 2020 to January 2023. However, the stock price took a halt in this uptrend and showed some correction. It has corrected about 30% from the highs, as the company has reported a declining net profit.
Glencore Stock is consolidating in a broader range between $480 and $390. It is currently a suitable contender for swing trading. The stock price has followed a similar kind of movement for the last few months. It has been trading in the same range which confirms that the price is in a consolidation phase.
Glencore stock is looking strong as of now. The bulls are frequently trying to breach the resistance level. They are holding the price near the resistance level, and this indicates that the sellers are not able to push the price down. It will be interesting to see whether the bulls conquer this resistance level or not.
An outline of the GLEN Stock Chart
The GLEN stock price has formed a rising channel pattern on the chart. It is currently trading very close to the upper trendline resistance and is looking very strong. The stock price is currently trading comfortably above the 50-day and 200-day Exponential Moving Averages (EMAs). It has witnessed a golden crossover recently, which is holding the price at higher levels.
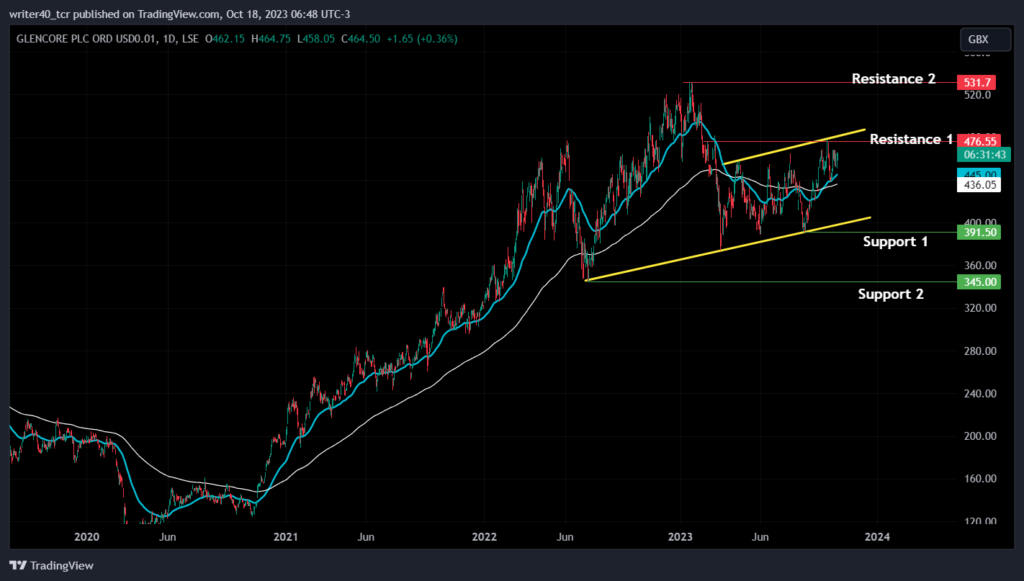
The GLEN stock price has faced resistance from the level of $476.55 and apart from this, the other resistance level for the stock is present at the level of $531.7. The lower trendline of the rising channel pattern can act as a support to the price. It is currently present near the level of $398.5. Other support levels are present at the level of $391.50 and $345.00.
An overview of the Bollinger Band and Relative Strength Index
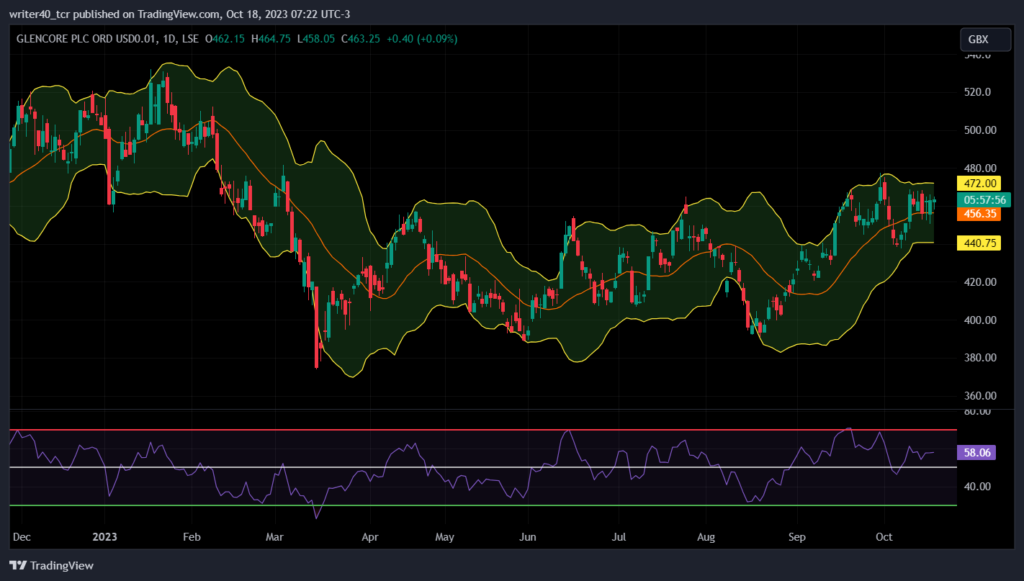
If we observe the shape of the Bollinger Band, it is currently flat. This suggests that the stock price can witness some less volatile move ahead. Furthermore, the price can continue to be sideways for some time. The relative strength index (RSI) is currently curved comfortably above the halfway line. This shows that the odds are in the bulls’ favor.
Conclusion
The GLEN stock price is currently in a consolidation phase and is trading near the resistance level. If the price is able to cross the resistance level of $476.55, then it can try to move up to the resistance level of $531.7. However, if the price breaks the support level of $391.50, then it may fall towards the next support level of $345.
Technical Level
- Resistance – $476.55 and $531.7
- Support – $391.50 and $345
Disclaimer
The views and opinions stated by the author, or any people named in this article, are for informational purposes only. They do not establish financial, investment, or other advice. Investing in or trading crypto assets comes with a risk of financial loss.




