
 Bitcoin
 Quack AI
 Pudgy Penguins
 Quantus
 Solana
 Injective
 NEAR Protocol
- JP Morgan cut down the target price of the Metropolitan Bank Holding’s stock from $60 to $50.
- The Metropolitan Bank Holding stock price has declined by over 43% in 2023 and it has been in a downtrend for almost 2 years.
- The Metropolitan Bank Holding stock has formed a Symmetrical triangle pattern on the daily time frame.
Metropolitan Bank Holding stock price has ended its previous trading session with a rise of $0.89 or 2.76%. However, the stock price has formed a shooting star candlestick with a long upper wick, which shows the presence of active sellers in the stock. In the previous 3 trading sessions, the stock price ended the day in red with a similar kind of Bearish candle.
The Metropolitan Bank Holding share price has started the year with a major decline. It has fallen down by over 73% within 3 months of active trading. However, the stock price has halted the fall and created a bottom near the level of $15.41. Furthermore, the stock price has surged by about 250% from that lower level. It has again reversed from the high and is trading down by over 32%.
JP Morgan has cut down the target price of the Metropolitan Bank Holding stock. It has set the target price from $60 to $50 and maintains the overweight rating on the stock. The company has reported better earnings than the market estimates, which could be the possible reason behind the recent surge in the price.
A Quick Glance of the MCB Stock Chart
The MCB stock chart has formed a symmetrical triangle pattern and it is currently trading very close to the lower band of the pattern. It is showing great strength from there, which confirms that the buyers are present at that level. However, the recent behavior of the stock is telling a different story as the stock is forming a good bearish candle.
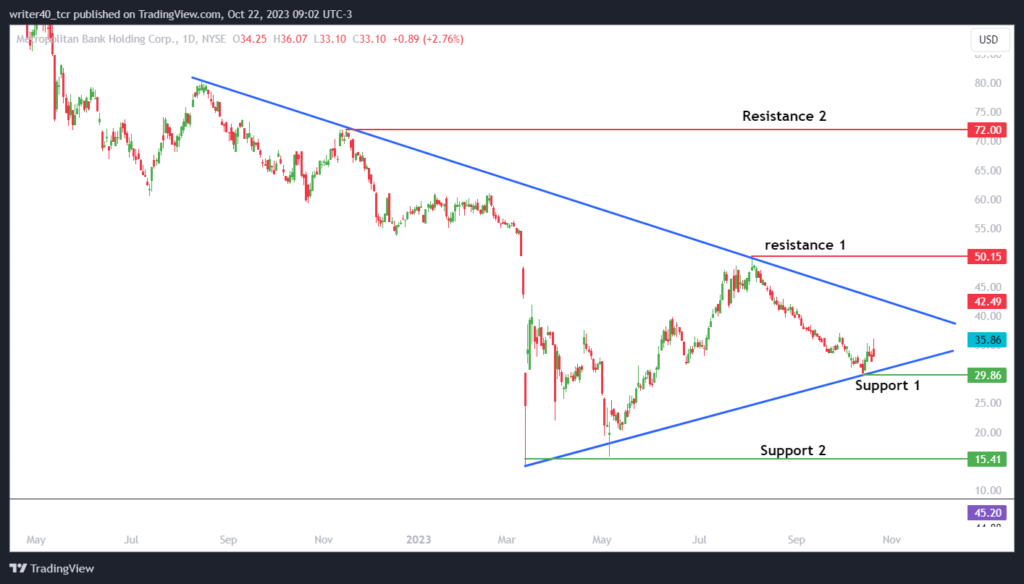
The support level for the MCB stock is present at the level of $29.86 i.e. the recent swing low of the stock. Apart from this, the other support for the price is present at the level of $15.41. Considering the resistance level, it is present at the level of $50.15 and $72.00. The trendline resistance level is present near the level of $43.35.
A Short Glimpse of the Indicators
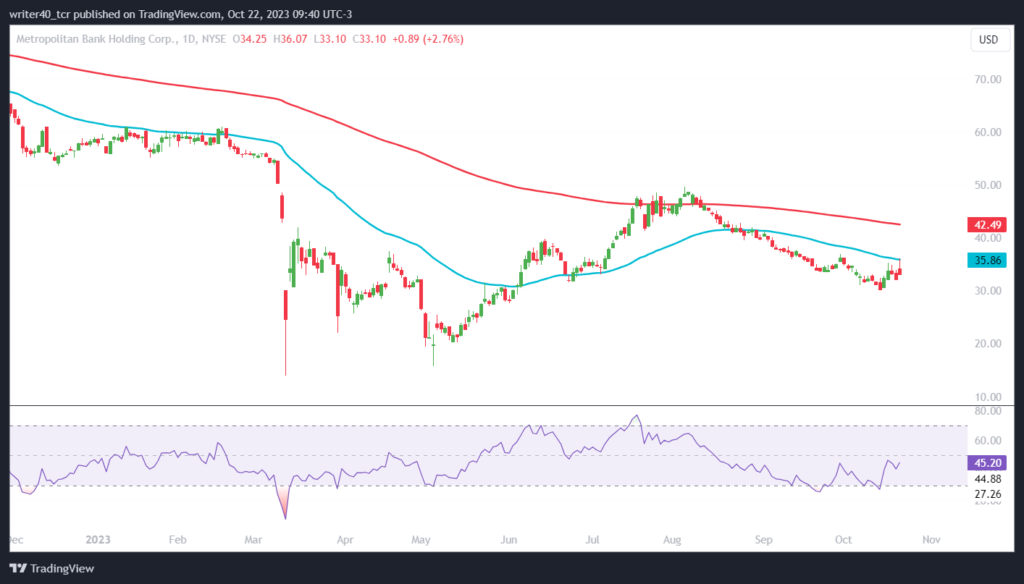
The MCB stock price has faced a strong rejection from the 50-day Exponential Moving Average and formed a strong bearish candle. It can possibly reverse the price from here as the price behavior is strongly favoring the Bears. The Relative Strength Index is placed at 45.20, which is below the halfway mark. It is a bearish signal as of now.
Conclusion
The MCB stock price has surged from the lower band of the symmetrical triangle pattern. However, it has not shown any kind of strength as the price is forming a heavy bearish candle, which can reverse the trend of the stock. If the price continues to rise, it can try to achieve the level of $50.15. A reversal from here can bring the price down to the level of $29.86.
Technical Level
- Resistance – $50.15 and $72.00
- Support – $29.86 and $15.41
Disclaimer
The views and opinions stated by the author, or any people named in this article, are for informational purposes only. They do not establish financial, investment, or other advice. Investing in or trading crypto assets comes with a risk of financial loss.




