
 Quack AI
 NEAR Protocol
 Lighter
 Bitway
 Pearl
Pearl Quantus
 Sui
Sui
- The PG stock price is currently trading above the 50-day and the 200-day EMA.
- The price broke below the rising wedge chart pattern.
Protector & Gamble (NYSE: PG) is an American manufacturer and marketer of consumer goods. It has a diverse range of branded products including Head and Shoulders, Tide, Ariel, Pantene, Pampers, and Gillette. The company has a business presence across the world. It sells its products through grocery stores, membership club stores, pharmacies, drug stores, department stores, etc.
Recent Actions of the PG Stock
The PG stock price showed the last quarter of 2022 turned into a bounce-back and experienced an increase of 26%. This surge countered the major downtrend that started in early 2022. Consequently, the company generated quarterly revenue of over $20 Billion along with $3.93 as a net income.
In March 2023, the price took support from the mid-trendline at $135.89 and formed an upper resistance for the rising wedge. Subsequently, it failed to break above the $158.26 resistance. It led to a breakdown of this pattern that favored sellers.
However, after the breakdown, the price fell over 6% and got some bullish reinforcement from the higher-low pivotal point. It may retest the trendline formed above.
Currently, the PG’s stock price is moving between the yearly range of $158.38 and $128.47. The stock has a yearly target of $169.00 with $6.16 as earnings-per-share. the total market capitalization of the PG is $354,075,015,479.
Can PG Stock Price Retest the Rising Wedge Pattern?
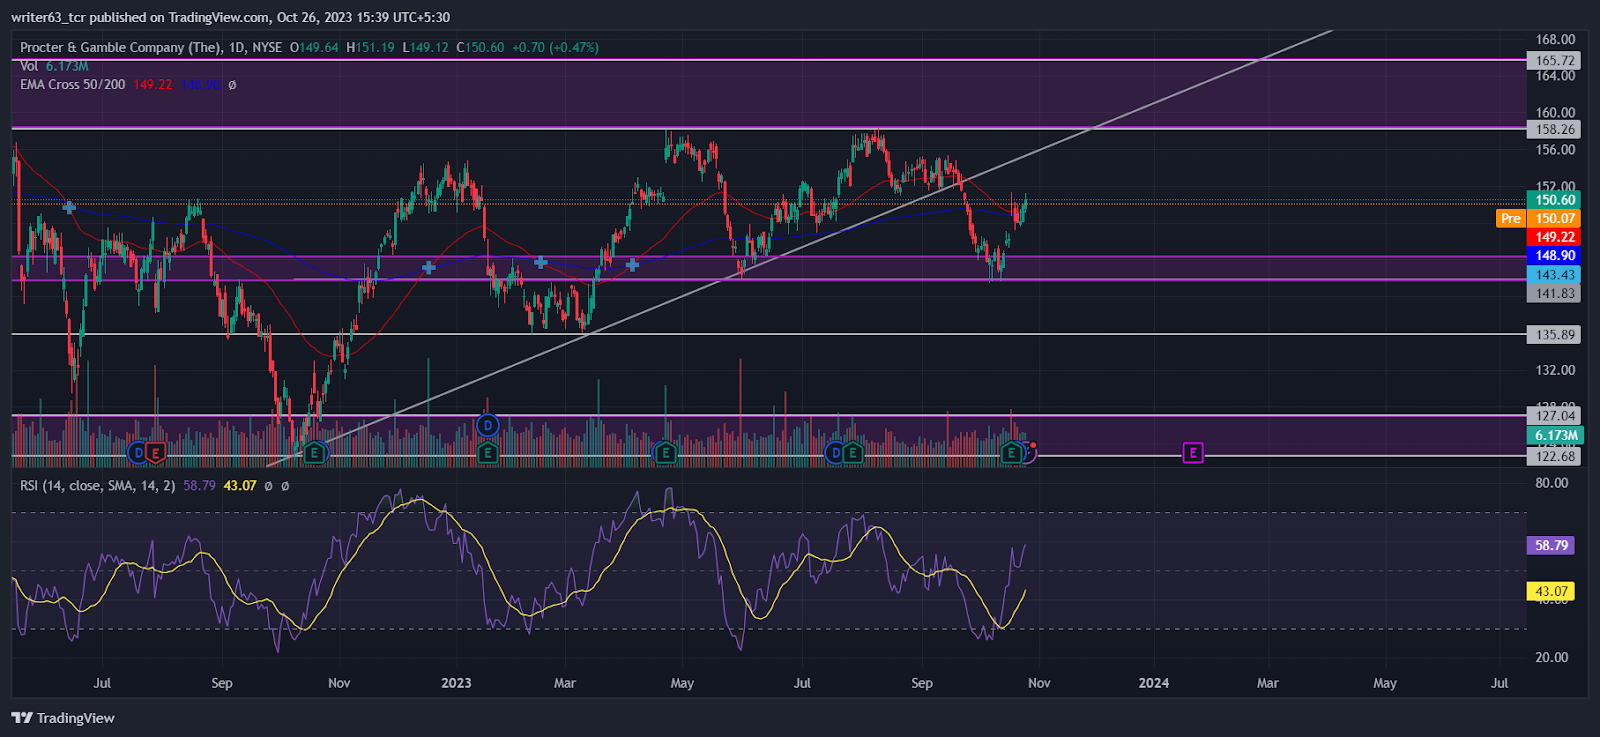
The 50-day EMA and the 200-day EMA are on the verge of a bearish crossover. PG stock price is trading slightly above the 50-day EMA and the 200-day EMA, reflecting price is at its average value.
PG’s stock price has given a breakdown of the rising wedge pattern at $150.84. Subsequently, it took support from the $141.83 immediate support level. At press time, the price is moving to retest the breakdown level of the rising wedge. In case, it bounces back from the breakdown level, it may probably fall to the $135.89 level. If the price manages to break above $158.26, it may go for the next resistance of $165.72.
On the other side, the relative strength index (RSI) has shown some signs of bearish divergence, which led to the price fall. The RSI is currently sloping at 58.79 above the signal line.
Conclusion
Finally, the PG stock price has given a breakdown from the huge rising wedge pattern. The 50-day EMA and the 200-day EMA both reflect the average value by being on the verge of a bearish crossover. At press time, the price is moving to retest the breakdown level of the rising wedge. In case, it bounces back from the breakdown level, it may fall to the $135.89 level. However, if the price manages to break above $158.26, it may go for the yearly target of $169.00.
Technical Levels
- Resistance levels: $158.26 and $165.72
- Support levels: $141.83 and $135.89
Disclaimer
The views and opinions stated by the author, or any person named in this article, are for informational purposes only. They do not establish financial, investment, or any other advice. Investing in or trading stocks comes with the risk of financial loss.




