
 Quack AI
 Pearl
Pearl Solana
 NEAR Protocol
 Canton
 XRP
XRP Derive
- Goldman Sachs maintains a Neutral Rating with a target price of $159.
- Procter & Gamble has recorded an 11-day losing streak, the longest since 2011.
- Procter & Gamble gave a breakdown of the Rising Wedge Pattern.
The current market price of the PG Stock – $144.78
The Procter & Gamble stock price is trading very close to its crucial support level of $141. The stock has been registered an 11-day losing streak which is the longest since 2011. This all was triggered when the company was sued in Florida over the Decongestant Cold Medicine. Along with that, some insiders have sold shares worth more than $8,70,000 according to a recent SEC filing.
The PG stock has surged by over 17% in a year. It shows that the price is in control of the bulls in the longer horizon. However, the recent events acted negatively on the share price as it has declined by over 5% in a month. The company has posted muted revenue and income growth in the last 4 quarters. It shows that the company is struggling to grow according to fundamentals.
According to the Option chain data, the major OI is present on the call side with a total OI of 8942. On put side, the total OI is 4782 and it is about half of the call. The support level of the price according to this data is present at $142 and $139. If we consider the resistance level according to the Option chain data, it is present at $146 and $148 levels.
A short glance at the Procter & Gamble chart
P&G stock price has given a breakdown from the Rising Wedge Pattern, which triggered an aggressive selling in the stock. The stock is trading at a support level of $140.88, which is also the previous swing low of it. If we observe the Exponential Moving Average, the current slope of the EMA is shifting downwards indicating a bearish sentiment.
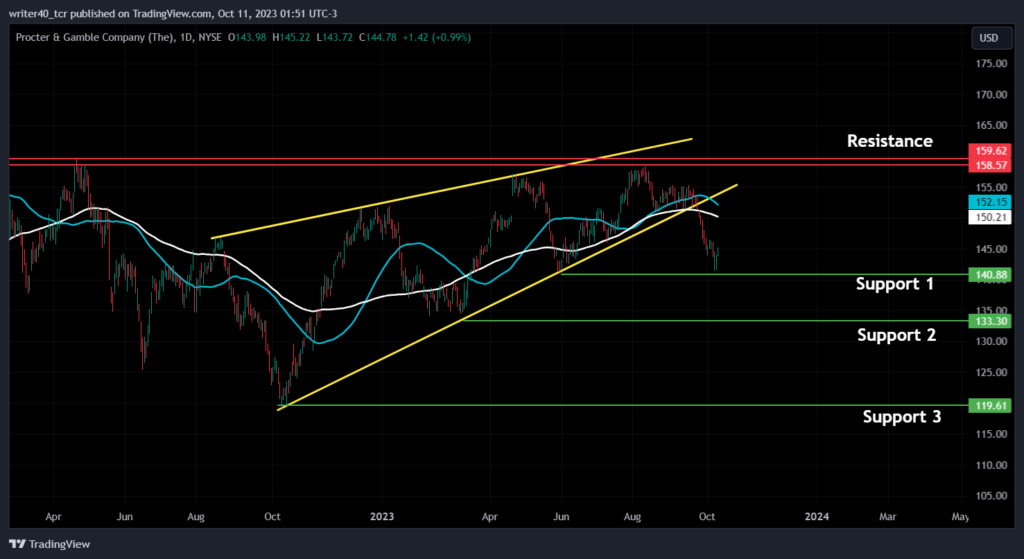
Both 50-day and 100-day Exponential Moving Averages are present at $150 and $152 levels, which can act as resistance for the stock. Apart from this, the other resistance for the stock is present at the level of $158 and $159. These are crucial resistance levels for the stock. It has faced rejection from this level in the previous year and is providing liquidity at the current time. If we consider the support level, it is present at $140.8, $133.30 and $119.61.
A Quick Overview of the Indicators
Bollinger Bands
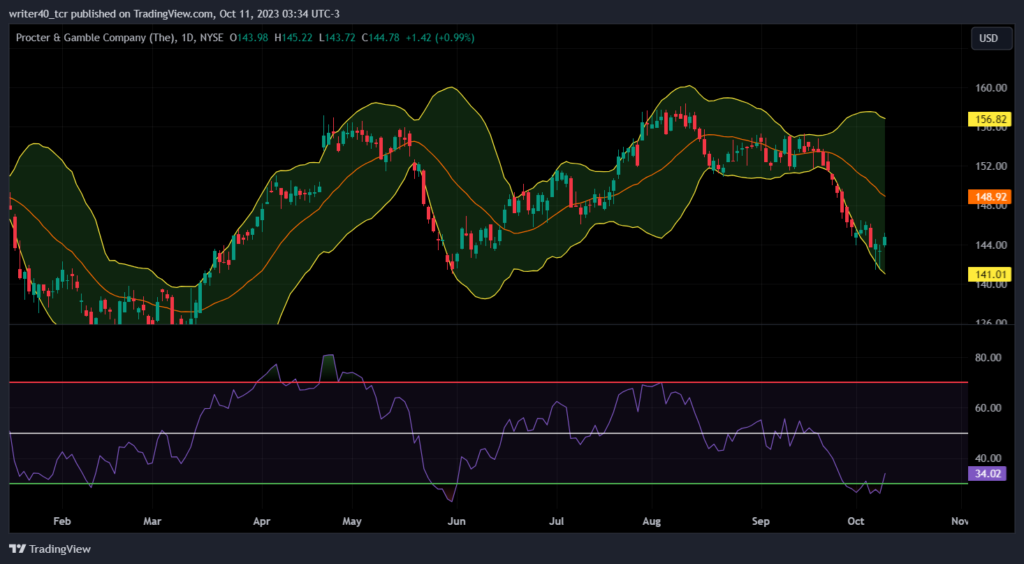
Currently, both the Bands i.e. Upper and lower band of the Bollinger Band is expanding. This indicates that the stock price has become very volatile now. The stock has formed a pin bar followed by long-legged Doji candles on the lower band of the indicator, which is a bullish sign.
Relative Strength Index
The relative strength index is currently placed below the 50 level, which is a bearish sign for the company. The PG stock has recently gone in an oversold trajectory according to the RSI. However, the curve of the RSI is now rising which is a positive sign for the buyers.
Conclusion
The PG stock price is trading very close to the support level of $140.88, which can restrict the price to go down. Both the indicators indicate that the price can show some upside from here. If the price rises from here, it can try to achieve the $158.57 level again. If the price breaks the support level of $140.88, it can move towards the level of $133.30.
Technical level
Resistance – $158.57
Support – $140.88 and $133.30
Disclaimer
The views and opinions stated by the author, or any people named in this article, are for informational purposes only. They do not establish financial, investment, or other advice. Investing in or trading crypto assets comes with a risk of financial loss.




