
 Quantus
 Starknet
 Pearl
Pearl Celestia
 Injective
 Sui
Sui NEAR Protocol
- Lloyds Banking Group beats the Q3 earning estimates.
- The LYG stock dropped about 26% while being in a downtrend.
- It closed at $1.96, with a loss of 2.00% in the pre-market trading.
Lloyds Banking Group’s (LYG) stock price has been in a downtrend since February 2023, consistently attaining lower lows from the initial high of $2.63. The long march of bears shattered the price by about 26% over the 8 months. However, the price began its uptrend in Oct 2022, with an incline surge of approximately 50%. The uptrend started from the initial low of $1.73 towards the high of $2.63.
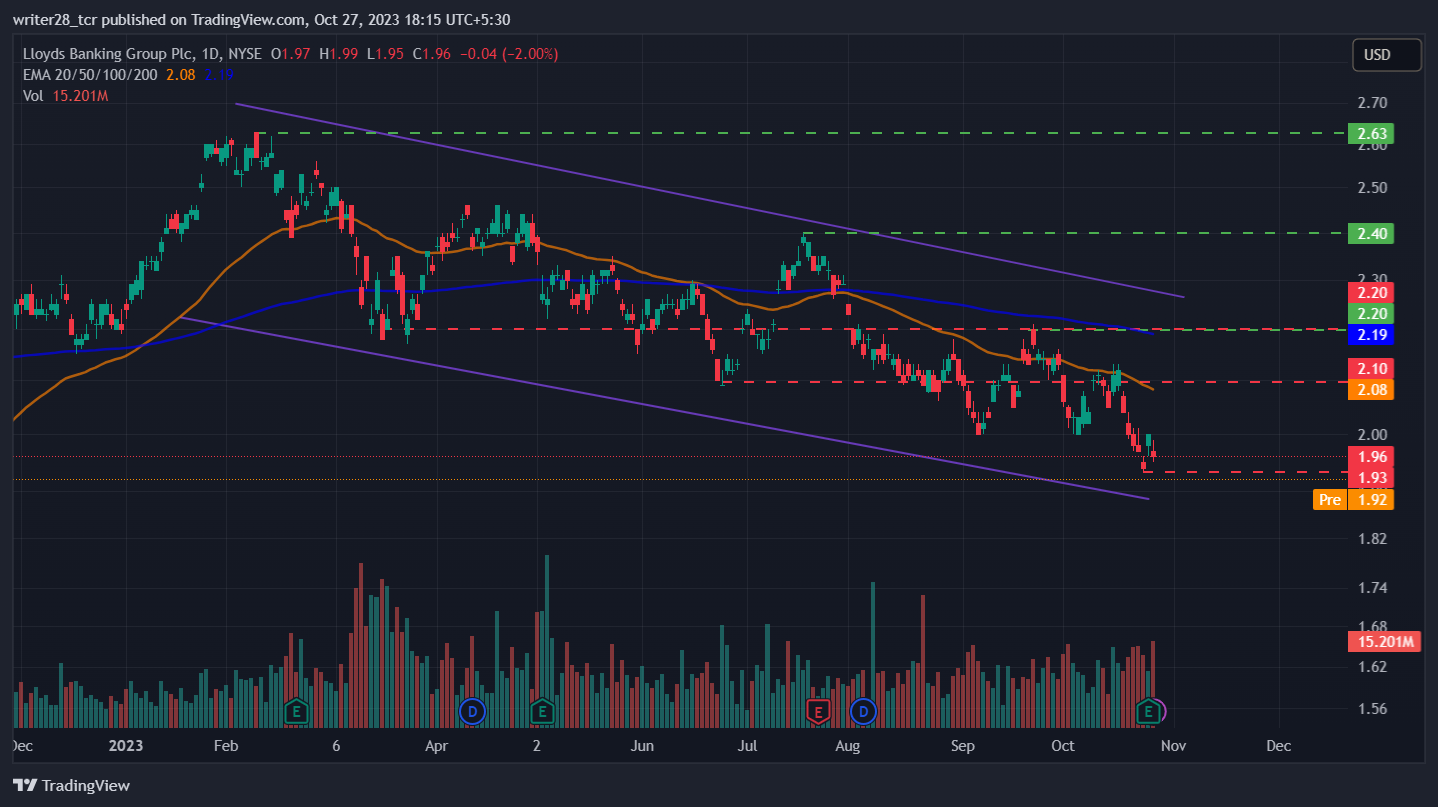
On July 24, 2023, Lloyds Banking Group announced its degraded second-quarter report, which encourages sellers in the market. Hence, bearish sentiment plummeted the stock price about 15% from the high of $2.35. However, the move was halted at the $2.00 support level.
After attaining a solid support level at $2.00, the bulls entered the market. It created a foreground to bounce back and recover from the prior losses. However, the bulls failed to do so and the rally got struck at a $2.20 resistance level. Hence, the prior $2.20 support level becomes a resistance, which denotes a descending triangle pattern.
Recently, LYG stock price closed at $1.96 while witnessing a decrease in the last session, with a high and low at $1.99 and $1.95, respectively. However, the descending triangle pattern shattered the performance of the stock price drastically. The current market capitalization is $31.55 Billion, with an average trading volume of 11.944 Million.
Lloyds Banking Group Beats The Q3 Earning Estimates.
Lloyds Banking Group (LYG) reported earnings of $0.10 per share, which reflects breakeven earnings surprise of 10.86%. Meanwhile, the Q3 reported revenue of $5.48 Billion failed to meet the consensus estimated revenue of $5.51 Billion. The Banking Group revealed its third quarter financial report on Oct 25, 2023, which offered a slight hike of 2%.
Will Descending Triangle Pattern Sustain?
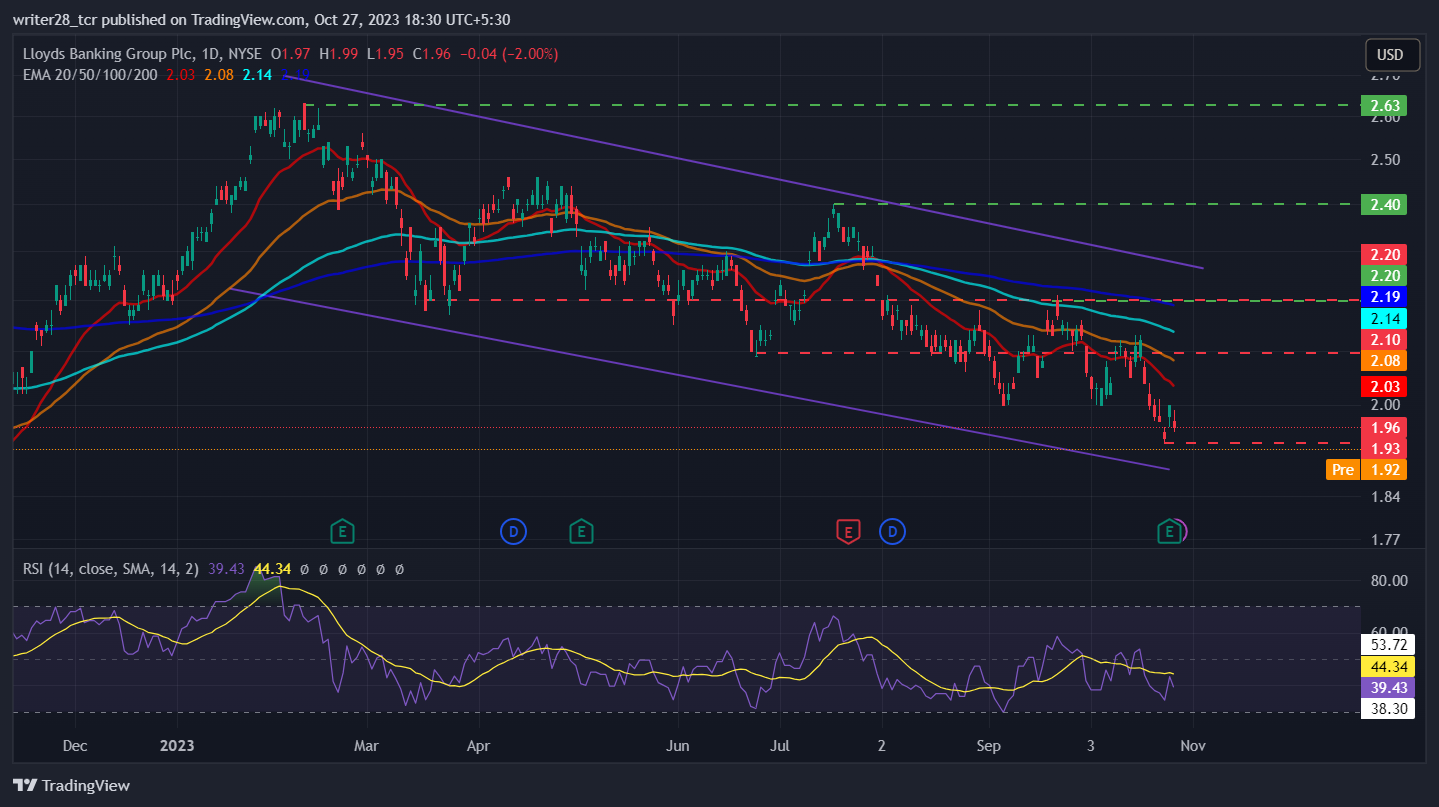
Lloyds Banking Group PLC (LYG) stock price is trading below the 20, 50, 100, and 200-day EMAs, indicating a rise in the participation of sellers in the market. However, if the bullish sentiment prevails, the price might retest the short-term moving average.
The Relative Strength Index (RSI) has been hovering below the 50-neutral zone since Oct 17, 2023. It denotes the price has shattered from the prolonged downtrend.
The RSI is at 39.43, which denotes the price might fall into the oversold region if the bearish sentiment sustains. The Chaikin Money Flow (CMF) dropped from the 0 mark and strands at -0.18, suggesting vigorous weakness in the market.
Conclusion
Lloyds Banking Group’s market structure and price action have suffered drastically during the downtrend and melted about 26% in the past 8 months. Traders should look for the selling opportunities as the technical parameters and analyst rating suggest the same.
Technical Levels
Major resistance: $2.63 and $2.56
Major support: $1.93 and $2.00
Disclaimer
The views and opinions stated by the author, or any people named in this article, are for informational purposes only. They do not establish financial, investment, or other advice. Investing in or trading crypto assets comes with a risk of financial loss.




