
 IGNITION
 streamoors
 Injective
 NEAR Protocol
 Pearl
Pearl LayerZero
 Quantus
- The Norwegian Cruise Line Holdings Ltd. has a very surprising debt/equity ratio.
- The NCLH stock price has declined by 3.68% in the last trading session.
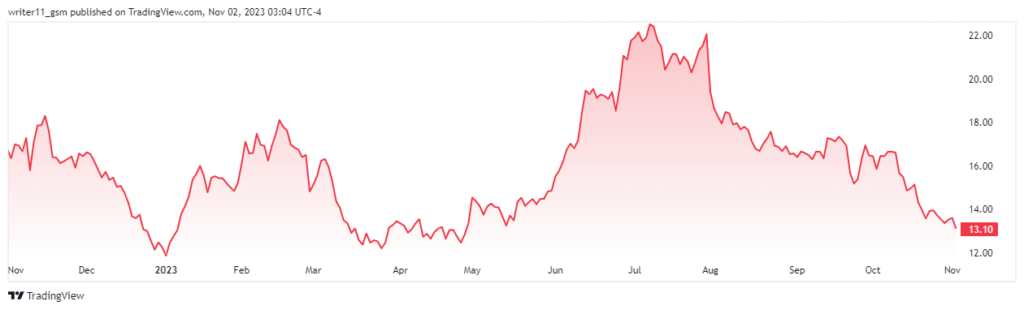
Norwegian Cruise Line Holdings Ltd. is an American cruise line company that has its hotels and resorts including the cruise. The company was founded in 1966 and has 38.9K employees. The current CEO of the company is Harry J. Sommer and it has its headquarters in Miami.
The Norwegian Cruise Line Holdings Ltd. does not pay any dividend to its shareholders which might be disappointing for the investors. However, the NCLH stock has a higher beta resulting in 1.93 which makes the stock’s returns more volatile.
NCLH has 421.145M shares available for trading and are floating in the market. The EPS for the stock is also negative to -$0.51 which denotes that the company is not profitable. The NCLH has a high debt/equity ratio of 86198.73%.
In the last three months, the resulting average trading volume for the NCLH stock is 12.671M. This is followed up with the last trading session volume of 22.686M which is much higher than the average volume of the stock. This denotes that there has been some high activity in the NCLH stock in the last trading session.
Norwegian Cruise Line Holdings Ltd. Stock Performance Analysis
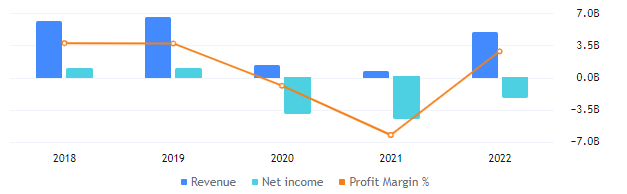
The company recently announced its Q3 results and the reports are positive. The revenue for the company has advanced by 57.0% resulting in $2.54B. The resulting gross profit of the company has also advanced by 437.1% year-on-year. The market cap of the company has advanced by 46.5% resulting in the advance of the stock price.
NCLH Stock Is Consistently Losing Its Price, How Further Will It Decline?
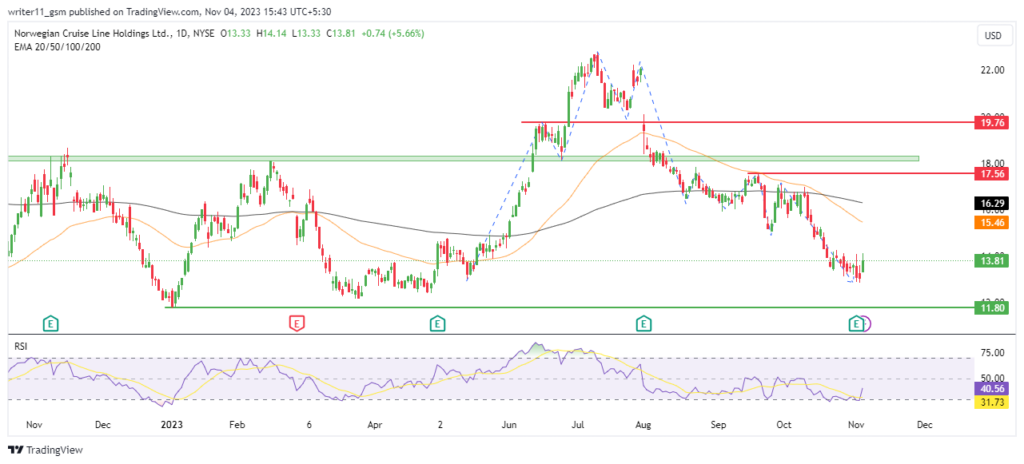
On the broader timeframe, the NCLH stock has lost its value by more than 80% from its all-time highs. This denotes that the stock price is following a strong downtrend as it is trading below 50% of its all-time high price.
The NCLH stock is forming lower highs on the charts leading to a further decline in the stock price. Also, the stock price is engulfing the lows of the previous days indicating the dominance of sellers in the stock price.
The 50-day and the 200-day EMAs are trading in a dearth cross formed on the chart a few trading sessions ago. This indicates a strong downtrend in the share price.
The RSI for the NCLH stock is trading at a level of 28.89 declining below the oversold zones. This indicates a strong presence of selling sentiment for the stock.
NCLH/NYSE Stock Chart By TradingView
Conclusion
As the technicals for the NCLH stock are giving a sell signal that the profit margin of the company is also negative. The stock is witnessing huge selling pressure and the stock price is leading to lower lows.
Therefore, the NCLH stock price might continue to decline to lower levels.
Technical Levels
- Support levels- $9.20 and $11.80
- Resistance levels- $17.50 and $19.70
Disclaimer
The information provided in this article, including the views and opinions expressed by the author or any individuals mentioned, is intended for informational purposes only. It is important to note that the article does not provide financial or investment advice. Investing or trading in cryptocurrency assets carries inherent risks and can result in financial loss.



