
 Minter
 Pearl
Pearl NEAR Protocol
 Pons
Pons Quack AI
 Quantus
 Sui
Sui
- SNDL stock is following a downtrend and is slowly declining to lower levels.
- The company has given a negative ROE over the years.
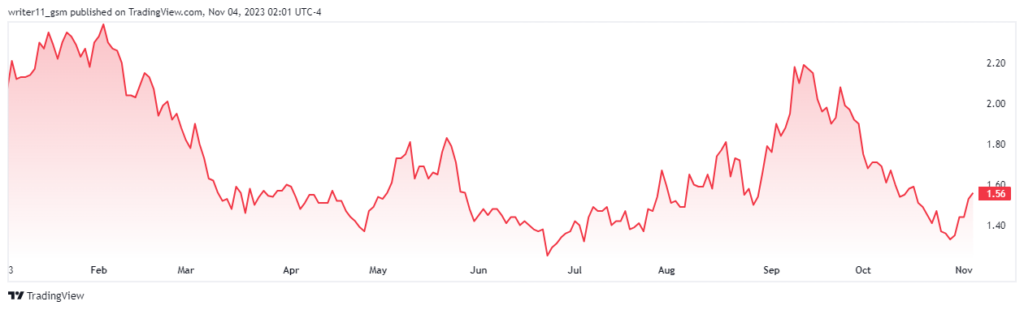
SNDL Inc. is a licensed producer of cannabis that uses state-of-the-art indoor facilities. It generally operates in segments like Liquor retail, Cannabis retail, Investments, and corporate. The company has its headquarters in Calgary and has 2.607K employees. The current CEO of the company is Zachary Ryan George and the company was founded in the year 2006.
SNDL Inc. does not pay any dividends to its shareholders which is pretty disappointing. The market cap of the company is only $406.006M and the net income of the company is also negative.
It has a basic EPS of -$0.91 which denotes the amount of money SNDL Inc. is losing on its each share. The company has 258.269M shares floating in the market followed by a beta of 1.84. This indicates that the SNDL stock is slightly more volatile than the overall market.
SNDL Inc. Stock Performance Analysis
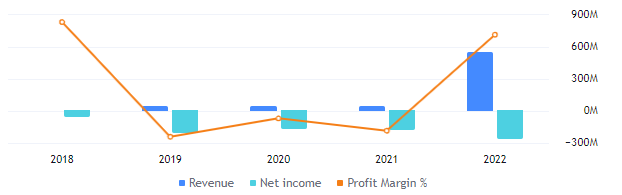
The debt for the company has advanced from the last year resulting in $125.34M. This has resulted in a negative free cash flow of -$13.35M followed by cash & equivalents of $220.62M. This further resulted in a gross profit of $77.381M following a negative net income of -$257.413M.
Will SNDL Be Able To Break Above The 200-day EMA?
The SNDL stock price is following a strong downtrend and the stock price has been consistently declining from the higher levels. This decline in the stock price has led to the formation of the falling wedge pattern and the share is still trading inside the same.
The 50-day and the 200-day EMA on the daily charts are following a death cross. The SNDL stock price is also trading below the EMAs which denotes bearishness in the stock.
The RSI on the daily SNDL stock charts is trading at 50.35 advancing above the 14-day SMA. If the RSI continues to advance and breaks above the current levels then the stock might result in a change of trend to bullish.
Conclusion
The SNDL stock price is following a downtrend and the stock price might continue to decline to lower lows. This is because the technical indicators on the charts are also giving a sell signal. The financials of the company are also weak which represents that the company needs to work hard for sustainability.
Technical Levels
- Support levels- $0.500 and $1.2500
- Resistance levels- $3.90 and $6.60
Disclaimer
The information provided in this article, including the views and opinions expressed by the author or any individuals mentioned, is intended for informational purposes only. It is important to note that the article does not provide financial or investment advice. Investing or trading in cryptocurrency assets carries inherent risks and can result in financial loss.




