
 Covenant x402
 Tetsuo Super Intelligence
 Doge Pepe
 Claudia
 Boomer
 Quantus
 Bitcoin
- SNDL Inc. (SNDL) stock has shown a decline of -22% in a year.
- The MACD line is creating a negative crossover.
- SNDL’s net income has decreased by 61% YoY.
SNDL, Inc. (NASDAQ: SNDL) is a licensed manufacturer specializing in the cultivation of small-batch cannabis within advanced indoor facilities.
SNDL Inc. stock is moving in a downtrend direction. The stock price has recently made an all-time low and is now moving near this level.
Financial Data of SNDL Inc.
SNDL stock is currently priced at $1.60, having experienced a decline of over 61% in net income within a year. The company has a share float of 2,558 million shares and an average trading volume of 3.3 million.
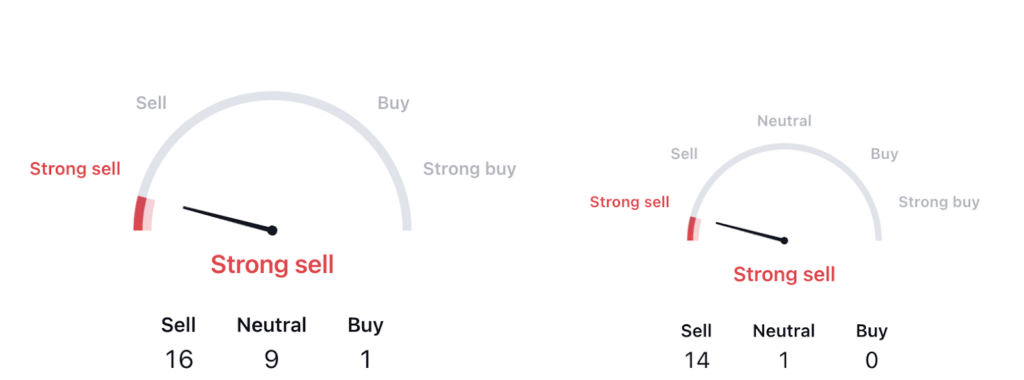
A technical analysis of indicators signals a bearish outlook for SNDL stock. The majority of the 26 indicators indicate a ‘strong sell,’ with 16 giving a ‘sell’ signal and only 1 signaling a ‘buy.’ Additionally, the moving averages confirm a ‘strong sell’ sentiment, suggesting the stock’s weakness and the potential for further declines.
SNDL stock reached an all-time high of $132.20 in July 2019, after which it began a downward trajectory. Sellers gained dominance over buyers, resulting in a significant price drop of nearly 99% in just a year and a half. This substantial loss has diminished investor interest in the stock.
Nevertheless, the stock has found support at the $1.20 level, leading to price consolidation within this range. This price movement has formed a descending triangle pattern. In the current market conditions, the stock exhibits signs of weak momentum.
The overall weekly pattern is bearish, reflecting weakness, and the company’s financial performance has led to negative returns, with a one-year decline of approximately -22%. These indicators point to a lackluster performance by the company.
SNDL Inc. (SNDL) Stock Price Analysis
Sndl by writer50_tcr on TradingView.com
Technical Indicators’ Overview
The MACD line is approaching the possibility of forming a bearish crossover, as both the MACD and signal lines show signs of reversing. This is a less optimistic signal for the price, and there’s a likelihood of a decline in the coming days.
The RSI is currently moving towards the negative territory, positioned close to the 40 level. The RSI line is situated below the signal line, which is a weak signal, further suggesting the potential for a price decrease in the upcoming days.
Conclusion
In conclusion, SNDL stock is moving downward with the formation of a lower lows pattern. SNDL stock had given a negative return in the previous year and the net income is also decreasing. Additionally, the indicators are giving a negative signal for the stock. Hence, there is a high probability for the price to fall in the future.
Technical Levels
Support Level: $1.22
Resistance Level: $1.62
Disclaimer
The views and opinions of the author or anyone in this article are for informational purposes only. They do not offer financial, investment, or other advice. Investing in or trading crypto assets involves the risk of financial loss.




