
 Covenant x402
 Doge Pepe
 Tetsuo Super Intelligence
 Claudia
 NEAR Protocol
 Boomer
 Pudgy Penguins
- Perion Network Stock price has surged by over 14% In a week.
- Perion Network reported its earnings report on November 1, 2023.
- The current Market price of the Perion Network is $28.51.
In the previous trading session, the Perion Network stock price has shown a slight decline of $0.06 or 0.21%. The stock price has formed a doji candle on the daily chart which has traded inside the range of the previous trading session. This move has formed an inside candle pattern on the chart, which is neither bullish nor bearish. If the price breaks the pattern on the upside, then bullish and if on the downside then bearish.
On 1st November 2023, the Perion Network reported its earnings reports and it beat the market estimate of adjusted EPS by a good margin. The street was expecting it to be in the range of $0.74 per share, but the company has reported $0.84 per share which is a good sign for the company. The stock price has taken this on a positive note and surged marginally from the lower level.
The Perion Network stock price has surged by over 14% in a week, which is a notable gain. However, the stock price is still trading 32% below the annual high level of $42.75, which it created on 17 April 2023. It indicates the bears have dominated the price for so long and the bulls are now trying to regain the higher levels.
Will The Bulls Take Control of $30 In Peri Stock?
The Peri Stock price has formed a downward-sloping trendline and the stock has reacted sharply from that trendline before. The bulls have tried to breach the trendline but the price didn’t sustain above and saw a huge decline. Peri stock’s price has recovered from the lower level and is inching towards the trendline and will try to challenge the sellers present there.
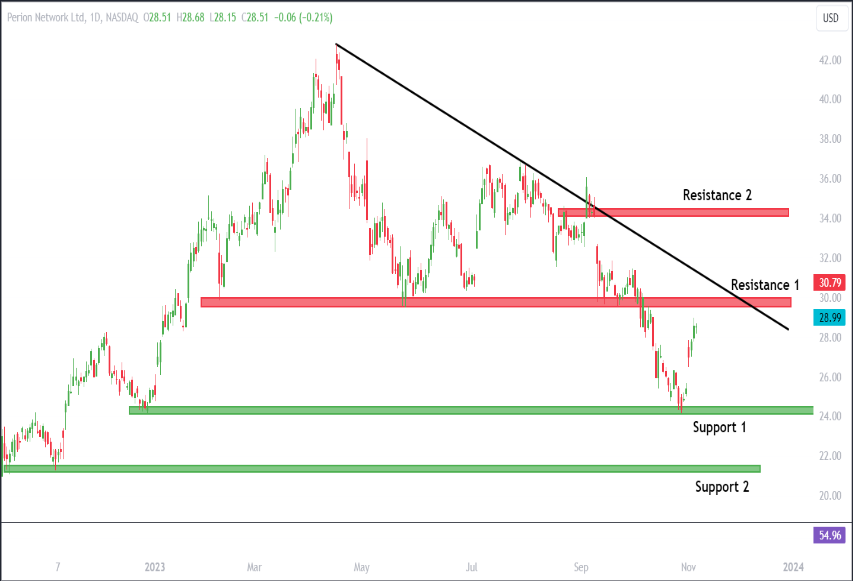
Peri Stock is trading very close to the resistance level of $29.65 which is marked as resistance 1 on the chart. If the stock price breaches this resistance and the trendline, then it can try to test the second resistance level which is present near $34.15. A rejection from the resistance level can bring the price back to the support level of $24.22 and $21.37.
A Short Glance on the EMI and RSI Indicator
Peri stock price is trading below the 50-day and 200-day Exponential Moving Average and currency the price is very close to the 50-day EMA. It is facing a rejection from the 50-day EMA. The Stock has witnessed a death crossover and declined heavily after that.
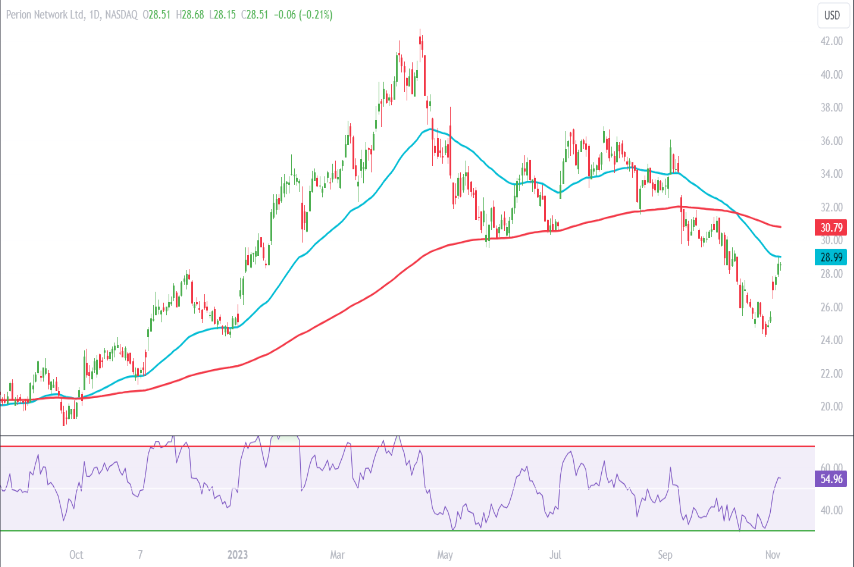
The Relative Strength Index is curving at 54.96 which is a sign of bullish momentum and the slope of the RSI is sharply up. It indicates that the bulls have gained the momentum with a bang.
Conclusion
The Peri Stock price has shown a great surge in recent times and the price is still looking strong. The RSI is favouring the bulls and the stock price is challenging the sellers present near the 50-day EMA level. The price can try to regain the 50-day and 200-day EMA in the coming days.
Technical level
Resistance – $29.65 and $34.15
Support – $24.22 and $21.37
Disclaimer
The views and opinions stated by the author, or any people named in this article, are for informational purposes only. They do not establish financial, investment, or other advice. Investing in or trading crypto assets comes with a risk of financial loss.




