
 Quack AI
 Pons
Pons Lighter
 Sui
Sui NEAR Protocol
 NeoSoul
 Quant
Quant
- Brookfield Infrastructure Partners stock’s price has surged by over 25% in a week.
- BPO Capital has adjusted the target price of the BIP stock.
- Cyxtera enters an Asset Purchase Agreement with Brookfield.
Brookfield Infrastructure Partners stock’s price has surged by over 25% in a week which is a remarkable gain for any stock. This surge happened after the circulation of the news, that the total assets of Cyxtera will be acquired by Brookfield Infrastructure Partners. They have entered into an Asset Purchase agreement and Brookfield will acquire the assets for $775 million.
Brookfield Infrastructure Partners stock’s price has shown a massive decline since July 2023. It has removed over 41% of its worth since then. Several rating firms have downgraded the target price which affected the investor’s confidence. The sellers have successfully seized the opportunity to drag the price down and created a new low of $21.03. It is the lowest price in three years.
BPO Capital has made an adjustment to its previous target price and set it to $38 from $42. However, it has maintained its previous rating of “overweight” on the Brookfield Infrastructure Partners stock. The company has recently released its earning report, in which the income has seen a fall but revenue and income from operations have risen for the Q3.
A Synopsis of the BIP Stock Chart
The recent behaviour of the BIP stock suggests that there is some serious buying happening at the lower levels. The stock price has formed some bullish candles on the daily chart. It is inching closer to the upper trendline, which has pushed the price down massively before.
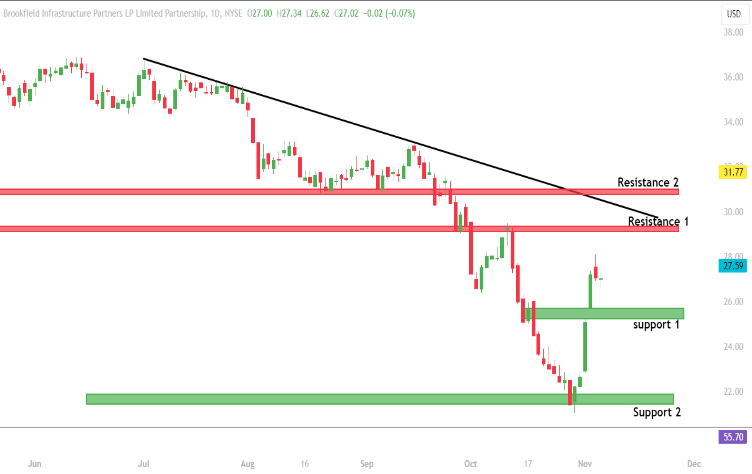
BIP stock price is trading close to the resistance level of $29.5 which is marked as Resistance 1 on the chart. If the price breaks this level, then it can try to test the second resistance level present near the level of $30.77. However, if the price reverses from the resistance level, then it can test the support levels present near the $25.70 and $21.90 levels.
A Guide to EMA and RSI Indicators On BIP Stock
The BIP stock price is trading below both the 50-day and 200-day Exponential Moving Average which indicates that it is still bearish. The stock price is facing resistance from the 50-day EMA and formed a strong bearish candle on the daily chart. However, in the previous trading session, it formed a doji candle and failed to provide a necessary follow-up on the selling side.
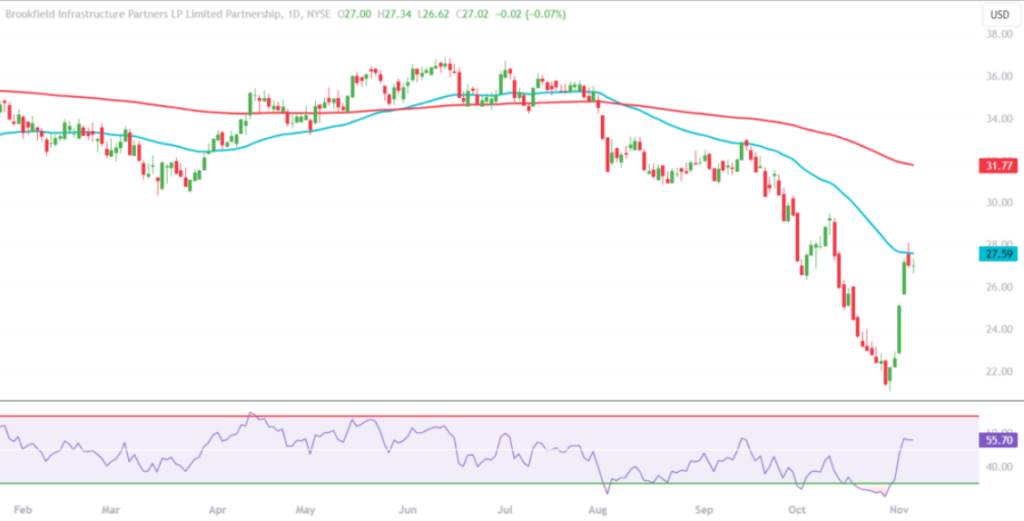
The Relative Strength Index (RSI) is curving at 55.70 which shows that the bulls have got the momentum in their side. The slope of the RSI is sharply upward which indicates the bulls are very aggressive on the stock.
Conclusion
The BIP stock price has a necessary momentum on the bull’s side and the price is looking strong. The future outlook of the stock is promising after the recent agreement and financial earnings. The price can show some more upside in the coming days and months.
Technical Level
Resistance level – $29.5 and $30.77
Support level – $25.70 and $21.90
Disclaimer
The views and opinions stated by the author, or any people named in this article, are for informational purposes only. They do not establish financial, investment, or other advice. Investing in or trading crypto assets comes with a risk of financial loss.




