
 Bitcoin
 Quack AI
 Pudgy Penguins
 Quantus
 Solana
 Injective
 NEAR Protocol
- Transocean Ltd. stock has shown a decline of -2.78% in today’s market session.
- Transocean Ltd. stock price has shown a recovery of more than 1250% after hitting a low.
- The net cash of the RIG company fell by 39.7% YoY.
Transocean Ltd. is involved in offering offshore contract drilling solutions for oil and gas well operations. The company possesses and manages offshore drilling fleets that encompass ultra-deepwater, challenging environmental conditions, deepwater, and midwater rigs.
Technical Analysis of RIG Stock
The price of RIG stock is currently in a downward trend, characterized by the formation of lower lows. The stock has breached a significant support level and continues to follow a downward trajectory.
An analysis of technical indicators indicates that most of the 26 indicators strongly signal a sell for the stock. This highlights the overall downtrend, with sellers holding away over its price.
Transocean Ltd. (RIG) is presently trading at $6.65, reflecting a decline of 2.78% in today’s market session.
The company’s net cash stands at $808 Million but it has declined by over 39.7% year-over-year (YoY). Additionally, the return on invested capital has decreased by 33.5% YoY, indicating a weakened financial performance by the company.
In Q3 2023, the company’s actual earnings fell significantly in comparison to the expected earnings, experiencing a notable decline of 50.67%. This decline in earnings underscores financial weakness and further contributes to negative market sentiments.
RIG stock reached its high at $163 in May 2008, after which, it experienced a substantial decline of 99%. It came close to a collapse, hitting an all-time low of $0.67. However, it found support at this level and has since produced an impressive recovery, rising by over 1250%.
The stock price recently made a peak of $8.80 but subsequently began declining again. It has shown a breakout from a channel pattern, hinting at a potential price decrease and supporting negative sentiments.
Transocean Ltd. (RIG) Technical Analysis
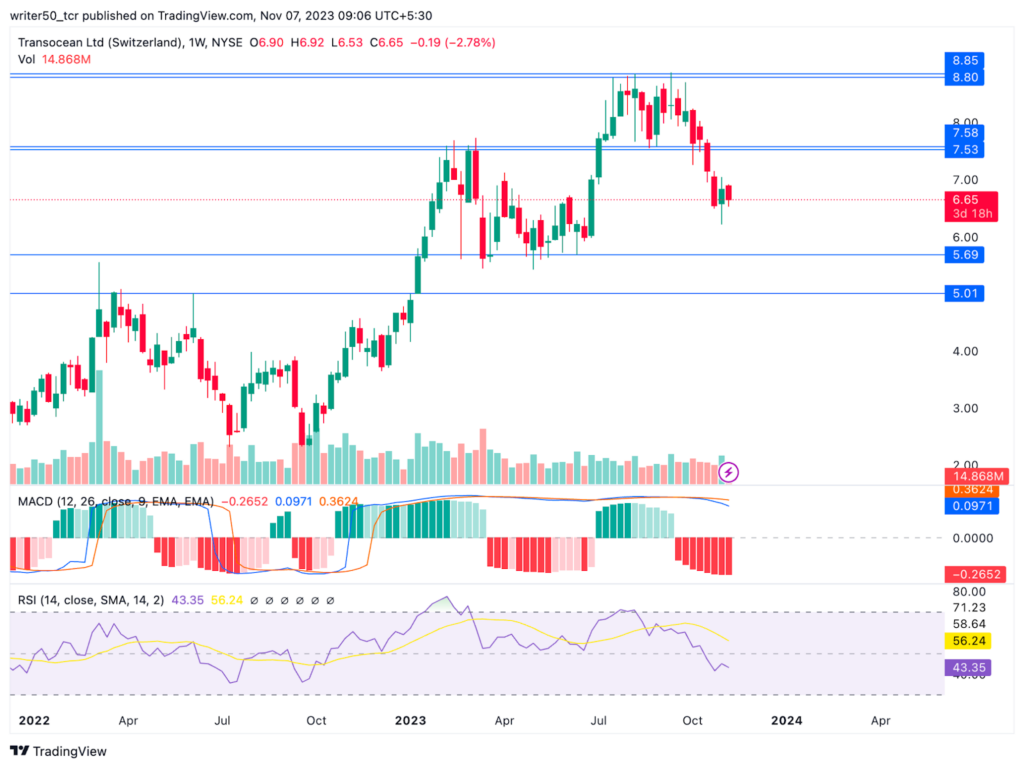
RIG stock’s MACD line finds itself positioned below the signal line. Typically, this configuration is regarded as a relatively weaker signal, suggesting the possibility of a price decline in the upcoming days.
Furthermore, the RSI line for RIG is exhibiting a downward path after entering the overbought territory. With its present level near 40, the RSI signals a diminishing trend, serving as a less robust indicator of the stock price.
Conclusion
The trajectory of Transocean Ltd. (RIG) stock is currently downward. The price has exhibited a negative return over recent months, and various indicators signal a pessimistic outlook for the stock. Moreover, the company’s earnings have declined, further raising the likelihood of a price decrease.
Technical Levels
- Support Levels: $5.69 and $5.01
- Resistance Levels: $7.53 and $8.80
Disclaimer
The views and opinions of the author, or anyone named in this article, are for informational purposes only. They do not offer financial, investment, or other advice. Investing or trading crypto assets involves the risk of financial loss.




