
 Minter
 Bittensor
 Quack AI
 NEAR Protocol
 Pons
Pons Pearl
Pearl Bitcoin
- The MACD indicator is forming a bearish crossover for the XLM coin.
- The volume for the XLM coin is declining.
Stellar is a decentralized blockchain network that is open-source, aiming to streamline the transfer of money and various assets between individuals and institutions worldwide.
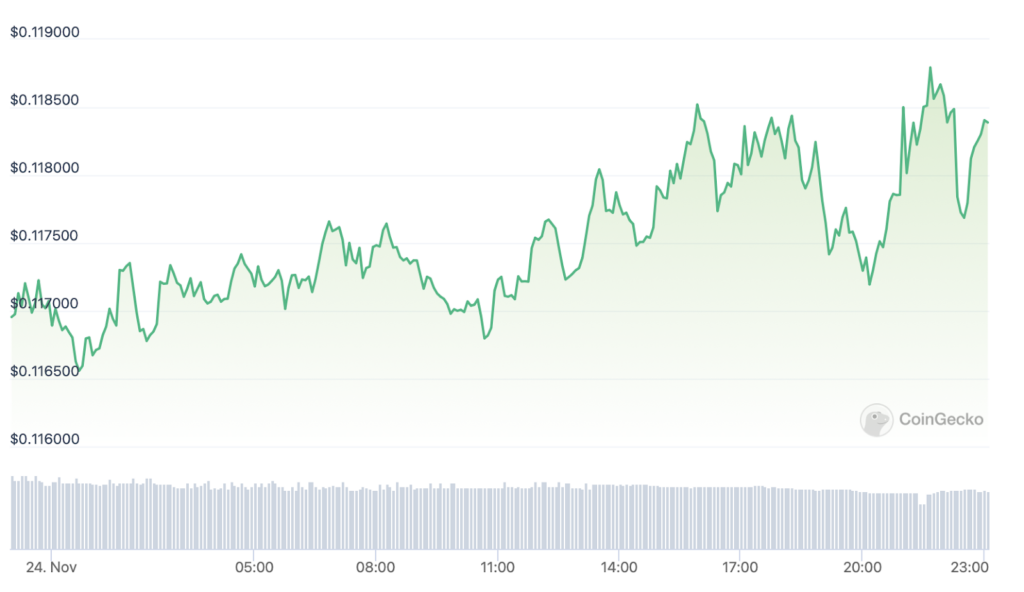
Financials of the XLM coin:
The current market price of XLM coin is $0.11 with a decline of 0.4% in today’s market session. The coin has a maximum supply of 50 Billion coins whereas only 27 Billion are circulated in the market.
This coin’s total trading volume is $38 Million and it has declined by over -26.2% in the last 24 hours. The declining volume represents that the sellers are dominating the market.
In the past 24 hours, the long liquidation for XLM amounted to $19k, while the short liquidation was $23k, resulting in a long/short ratio of 0.9932.
The open interest for the coin is $40 million, experiencing a decrease of 1.96%, and the volume/market cap ratio is calculated at 0.02.
Stellar (XLM) Technical Analysis
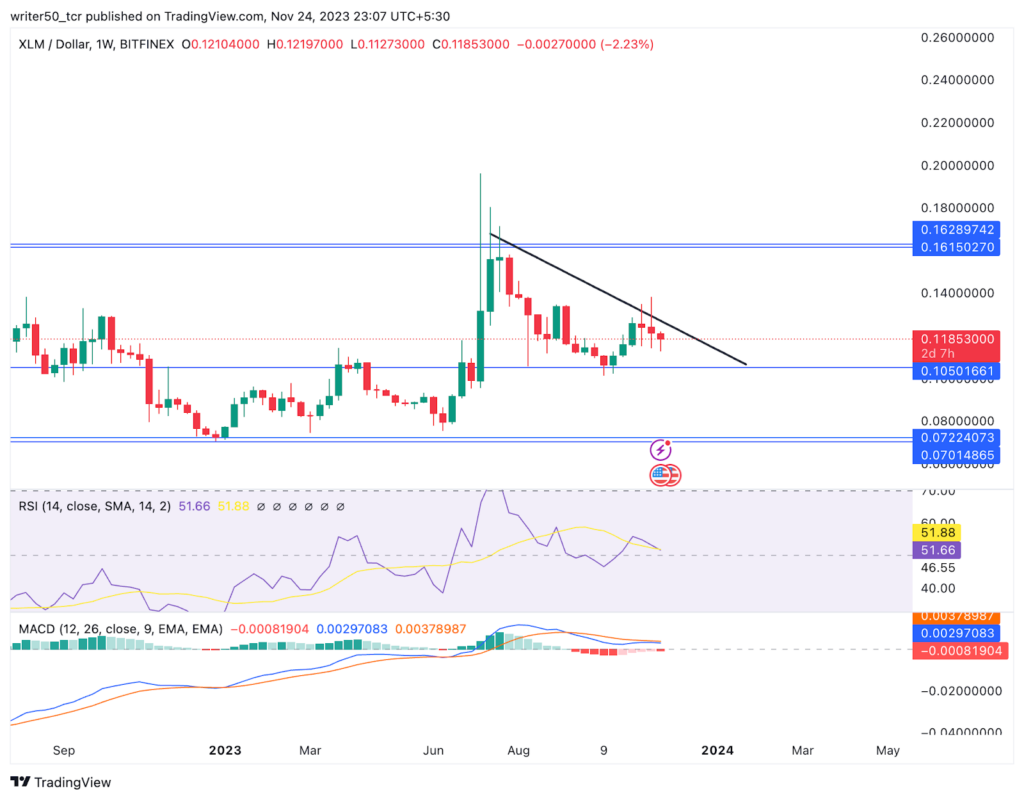
Stellar (XLM) has shown a 2.30% price increase in the past 7 days, lagging behind the broader cryptocurrency market, which has experienced a 3.90% uptrend. It also falls short when compared to other Smart Contract Platform cryptocurrencies, which have seen a 5.00% increase.
The coin is presently trading in the descending triangle partner. It is a negative pattern. The XLM reversed after hitting the resistance level and formed a continuous three red candles. That shows the sellers are dominating the price.
The overall structure of the coin is negative and the price is expected to decline in the upcoming days.
Technical Indicators Overview:
The MACD line for XLM indicates a weak scenario. The MACD is below the single line and the red histogram has been formed, indicating a bearish pattern.
Additionally, the RSI line remains close to the 50 level. It is staying below the SMA line, which provides a negative signal.
XLM/USD Live Chart by Tradingview
Conclusion
In conclusion, the XLM coin exhibits indications of a downward trend, as the price navigates within a descending triangle pattern and demonstrates weak returns over recent months. Furthermore, the indicators present a negative outlook for the coin, signaling a potential decline in its price.
Technical Levels
- Support Levels: $0.10 and $0.07
- Resistance Levels: $0.12 and $0.16
Disclaimer
The views and opinions of the author, or anyone named in this article, are for informational purposes only. They do not offer financial, investment, or other advice. Investing or trading crypto assets involves the risk of financial loss.




