
 NEAR Protocol
 Pyth Network
 Uniswap
 Pearl
Pearl Quantus
 Aerodrome Finance
 Starknet
- Trading volumes of the Fantom crypto witnessed a decline.
- The trading price of the FTM has declined by 17.5% in the last 30 days.
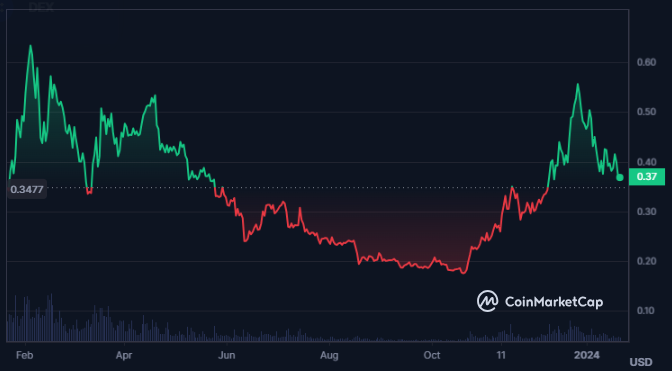
Fantom is a DAG-based blockchain platform for fast, secure, and versatile transactions. FTM is its token that enables staking, governance, payments, and fees. Fantom was founded by Michael Kong, Dr. Ahn Byung Ik, and Dr. Ahn Byung Jun in 2018.
Fantom crypto has a market cap dominance of 0.06% and the market cap of the crypto has advanced by 0.17% in the last 24 hours. The crypto also has a volume/market cap ratio of 6.95% and it is the 62nd largest crypto in the world.
The open interest of the Fantom crypto has advanced by 1.17% in the last 24 hours resulting in $69.863 Million. Despite this, the derivatives trading volume of the crypto has declined by 28.9% in the last 24 hours.
Fantom is trading with a long/short ratio of 0.9275 witnessing a long liquidation of $518.05K against the short liquidation of $50.75K. The derivatives data following the last 24 hours outlook shows sellers’ dominance over the crypto price.
Fantom Token Overview
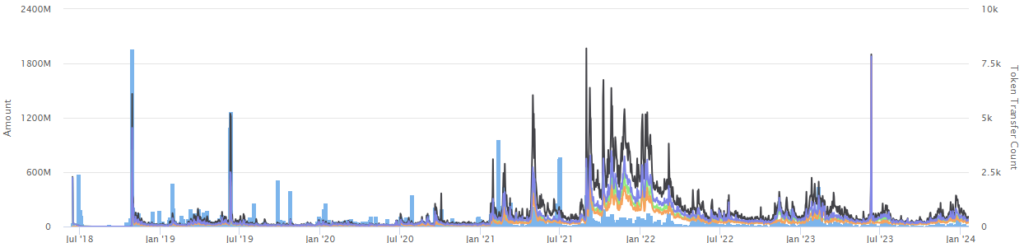
The Fantom token has 108K holders and the fully diluted market cap of the crypto is $782.649 Million followed by a circulating supply of 2.083 Billion FTM. Moreover, the total supply of the crypto is 3.175 Billion FTM.
The stablecoins market cap of the Fantom crypto is $415.23 Million and the revenue generated by the crypto over the last 24 hours is $361.39. Further, the inflows record as per DefilLama is worth $115K.
FTM Crypto Technical Analysis
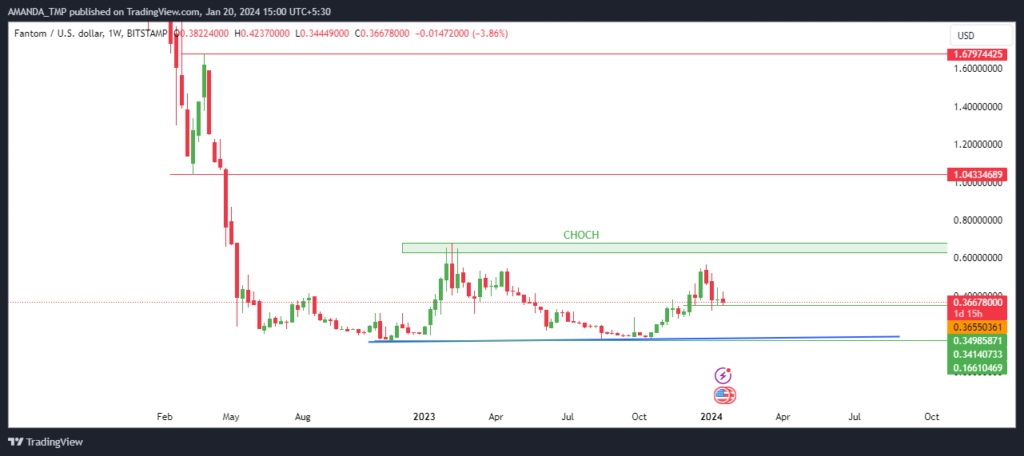
From the most recent swing low, the price of the FTM crypto advanced by 233% but failed to break above the crucial resistance levels. The price of the crypto is facing profit booking from the higher levels but is still above 50% of the whole move.
The following behavior of the crypto price shows the possibility of further advances in the crypto price in the future. Therefore, one must wait for the crypto price to break above the resistance level.
Thus, if the price breaks above the crucial resistance level of $0.68800, and sustains above the same, $1.04 and 1.6700 would act as the next resistance levels.
FTM/USD Chart by TradingView
The crucial EMAs such as the 20, 50 and 200-Day EMAs are trading in a golden cross while the price of the FTM crypto has declined below the 50-Day EMA. This indicates a weakness in the trading price.
If the price of the crypto further breaks below the 200-Day EMA, we might witness further decline in the trading price of Fantom crypto.
The MACD is showing bearishness on the charts as the MACD and the signal line are trading in a bearish crossover and have declined below the zero level. The indicator also forms a bearish histogram on the chart.
The RSI is trading at a level of 42.13 declining below the 14-Day SMA. Although the RSI is presenting weakness on the chart, if it rebounds above 50, the price of the crypto might lead to higher levels.
Summary
Fantom has a low market dominance and faces selling pressure. FTM price is below resistance and may decline further. Technical indicators are also bearish on the charts. Therefore, if the price of the crypto fails to break above the resistance, a decline in the trading price of the crypto is likely.
Disclaimer
This article is for informational purposes only and does not provide any financial, investment, or other advice. The author or any people mentioned in this article are not responsible for any financial loss that may occur from investing in or trading. Please do your research before making any financial decisions.




