
 Dacity Coin
 NEAR Protocol
 Quantus
 Bitcoin
 Celestia
 Pearl
Pearl Pudgy Penguins
- The ALT crypto is trading close to its all-time high price.
- The AltLayer crypto price has increased by more than 50% from its all-time low.
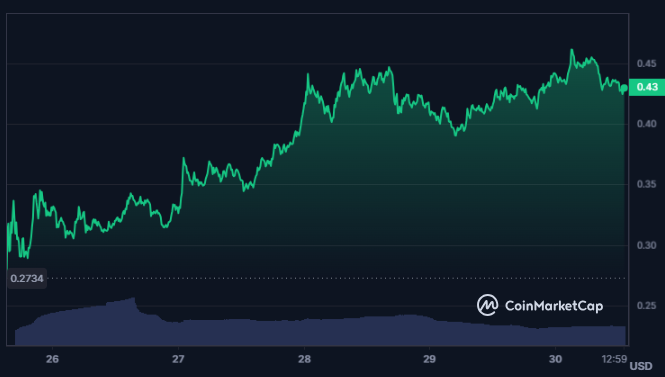
AltLayer is a protocol for restaked rollups, which enhance rollups with security, decentralization, interoperability and fast finality.
ALT is the native token of the platform and it is used for governance, incentives, and fees. AltLayer offers three products: VITAL, MACH, and SQUAD, for validation, finality, and sequencing of rollups. AltLayer raised $22.8 Million in private sales.
The trading volume of the Altlayer crypto has declined by 5.1% in the last 24 hours along with a slight increase of 1.9% in the market cap of the crypto. The current market cap of the crypto is $472.273 Million.
The crypto is trading with a circulating supply of 1.1 Billion ALT and the max supply of the crypto is 10.0 Billion ALT. Additionally, the fully diluted market cap of the crypto is $4.305 Billion while the circulating supply is 11% of the max supply.
The volume/market cap ratio of the AltLayer crypto is 67.85% and the value of the volume traded in the last 24 hours is $320.366 Million.
AltLayer Crypto Derivatives Analysis
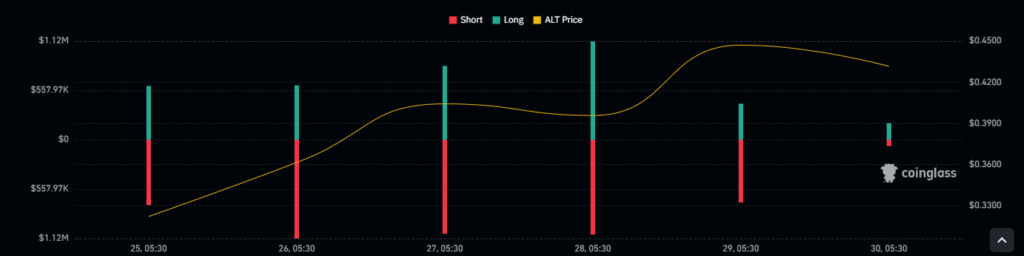
The buyers and sellers seem to be struggling to win the battle as the AltLayer crypto has witnessed a long liquidation of $521.82K while the short liquidation for the crypto is worth $581.84K.
The current long/short ratio of the crypto is 0.9845 and the open interest for the crypto has declined by 5.05%, resulting in $53.68 Million. Furthermore, the derivatives trading volume of the crypto has declined by 22.05% in the last 24 hours.
ALT Crypto Technical Analysis
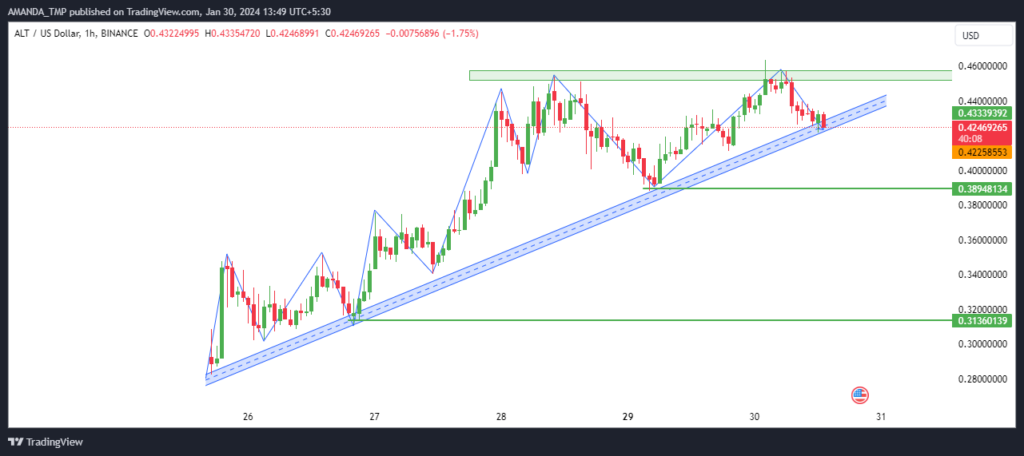
The ALT crypto price is following an uptrend by relying on the dynamic trendline and based upon the most recent price action, the ALT price is taking support at the dynamic trendline.
If the price of the crypto further breaks below the dynamic trendline, we might witness a change in the trend of the crypto, resulting in a further decline of the price.
ALT/USD Chart by TradingView
The trading price of the ALT crypto has declined below the crucial EMAs like the 20-day and the 50-day EMAs. Despite this, the 50-day and the 200-day EMAs are forming a golden cross.
If the price of the crypto continues to sustain above the 200-day EMA, we might get to see a further surge in the price.
The rest of the indicators like the MACD and the RSI are reflecting a decline in momentum.
The MACD and the signal lines have dropped to the zero level on the 30-minute timeframe chart and the indicator is witnessing the formation of bearish histograms.
The RSI is declining from the overbought zones and has reached the level of 39.16 and furthermore, the 14-day SMA line has also declined below the 50-level.
Summary
The ALT crypto has surged to new highs and is following an uptrend on the larger timeframes. It has strong support from the 200-day EMA and if the RSI and the MACD rebounds, we might witness new highs in the price.
Disclaimer
This article is for informational purposes only and does not provide any financial, investment, or other advice. The author or any people mentioned in this article are not responsible for any financial loss that may occur from investing in or trading. Please do your research before making any financial decisions.




