
 Bitcoin
 Starknet
 Pearl
Pearl ZKsync
 NEAR Protocol
 Quantus
 Zerebro
- The Aptos crypto price has increased by 0.73% in the last 24 hours.
- As per Coincodex, the sentiment for the Aptos crypto is very bullish.
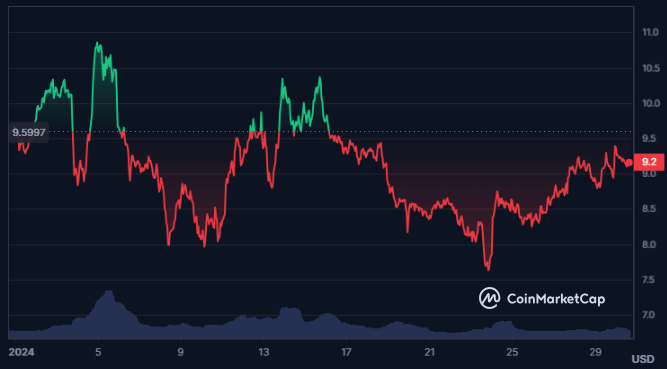
APT is a layer 1 blockchain token that uses Move, a smart contract language, and AptosBFT, a consensus mechanism. It is used for fees, staking, and governance on the Aptos network. Aptos Labs, founded by former Meta employees, created the Aptos project in 2021.
The derivatives trading volume of Aptos has declined by 15% in the last 24 hours along with a decline of 7.05% in the spot trading volume of the crypto. Additionally, the spot traded volume value for the crypto is $135.173 Million.
The current market cap value of the Aptos crypto is $3.084 Billion and the market cap ranking of the crypto is 29th as per CoinMarketCap. Furthermore, the volume/market cap ratio of the crypto is 4.58% while the circulating supply is 337.423 Million APT.
Aptos has a market cap dominance of 0.18% and the volatility of the crypto is considered very high as it is 6.65% as per CoinCodex. Additionally, the supply inflation of the crypto is 159.55% which is again a high number for the crypto.
Aptos Crypto Blockchain Data Overview
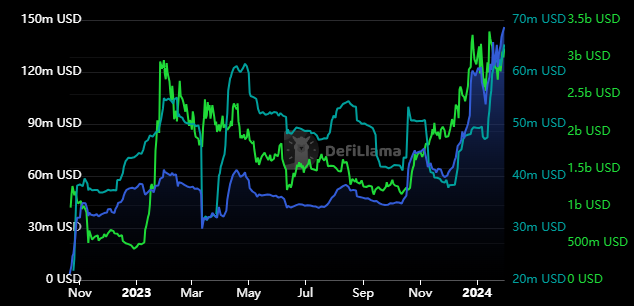
The total value locked for the Aptos crypto is $145.87 Million and the stablecoins market cap of the crypto is $65.25 Million. Furthermore, the total amount raised by the crypto is worth $350 Million and its fully diluted valuation is $9.90 Billion.
Moreover, the max supply of the crypto is infinite while the total supply is 1.078 Billion APT.
APT Crypto Technical Analysis
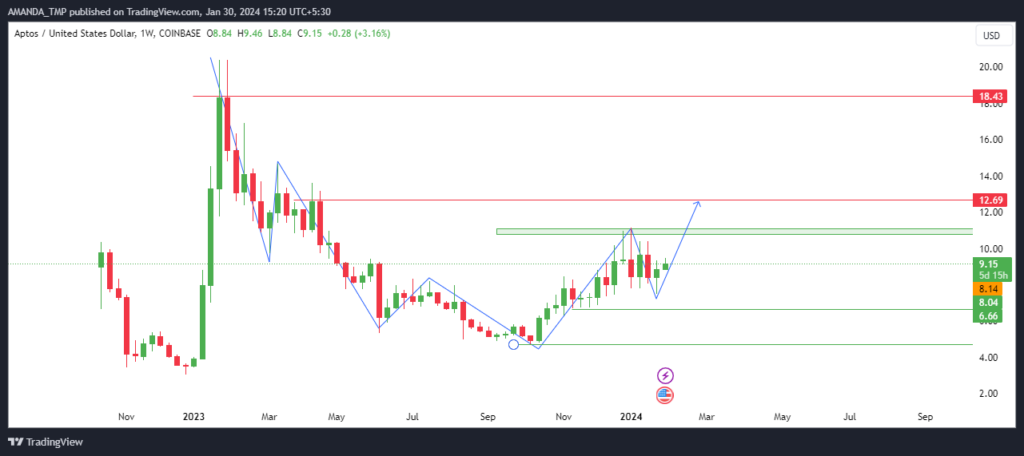
From the all-time highs, the APT crypto lost its value by more than 80% but is again trying to recover from the lower levels by forming higher highs. The price of the crypto is forming a higher high structure on the chart.
It has formed a most recent swing of $11.12 and if the price of the crypto breaks above this level, we might witness further increases in the price.
APT/USD Chart by TradingView.com
The price of the Aptos crypto is above the 20-day and the 50-day EMAs followed by the golden cross of 50-day and 200-day EMA. Moreover, the EMAs are are slowly advancing to higher levels.
The MACD of the crypto has declined below the zero level but has formed a bullish cross by rising above the signal line.
The RSI is above the 50-level and has also advanced above the 14-day SMA. The RSI also is following bullish momentum on the charts and shows the possibility of an advance in the price.
Summary
The APT crypto is recovering from its lows and breaking new highs. It has technical support from the EMAs, the MACD, and the RSI. It could skyrocket in the near future as it gains more adoption and recognition.
Disclaimer
This article is for informational purposes only and does not provide any financial, investment, or other advice. The author or any people mentioned in this article are not responsible for any financial loss that may occur from investing in or trading. Please do your research before making any financial decisions.




