
 Zerebro
 Bitcoin
 Quantus
 Pearl
Pearl Starknet
 ZKsync
 NEAR Protocol
- The Litecoin crypto price has increased by 6038% from its all-time low.
- The LTC crypto is trading with a medium volatility of 3.59%.
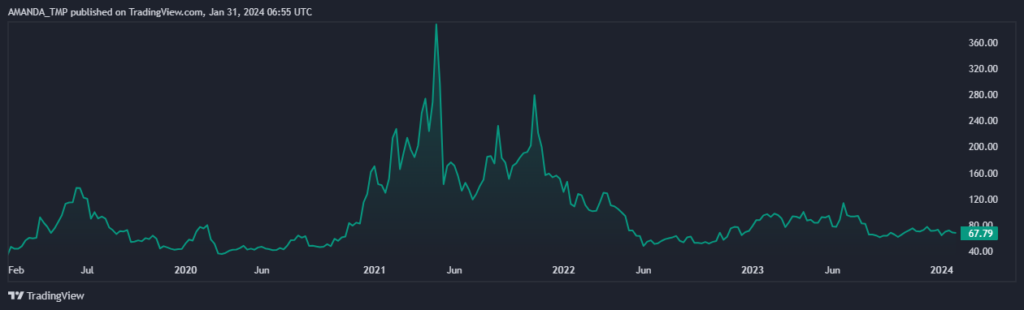
Litecoin is a fork of Bitcoin that offers faster and cheaper transactions. It was created by Charlie Lee, a former Google engineer and Coinbase executive. Litecoin uses PoW mining. It also pioneered SegWit and Lightning Network technologies.
The market cap of the Litecoin crypto is flat with a slight decline of 0.47% in the last 24 hours. The current market cap ranking of the Litecoin crypto is 19th, as per CoinMarketCap.
The value of the traded volume for the Litecoin crypto in the last 24 hours is $243.057 Million and after a decline of 12.5%. Additionally, the market cap of the crypto is $243.08 Million.
The derivatives trading volume of the crypto has declined by 25.7% in the last 24 hours, resulting in a value of $229.79M. The open interest of the crypto is trading flat. Additionally, the long/short ratio of the crypto is 0.9402.
The supply inflation of the Litecoin crypto is low at -8.43% and the market cap dominance of the crypto is 0.03%.
Litecoin Blockchain Data Overview
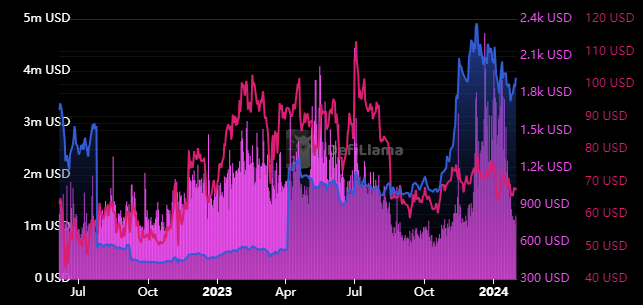
Litecoin has a total value locked of $3.86 Million and the fully diluted valuation of the crypto is $5.698 Billion. Moreover, it has a total supply of 84.0 Million LTC while its circulating supply is 74.153 Million LTC.
LTC Crypto Technical Analysis
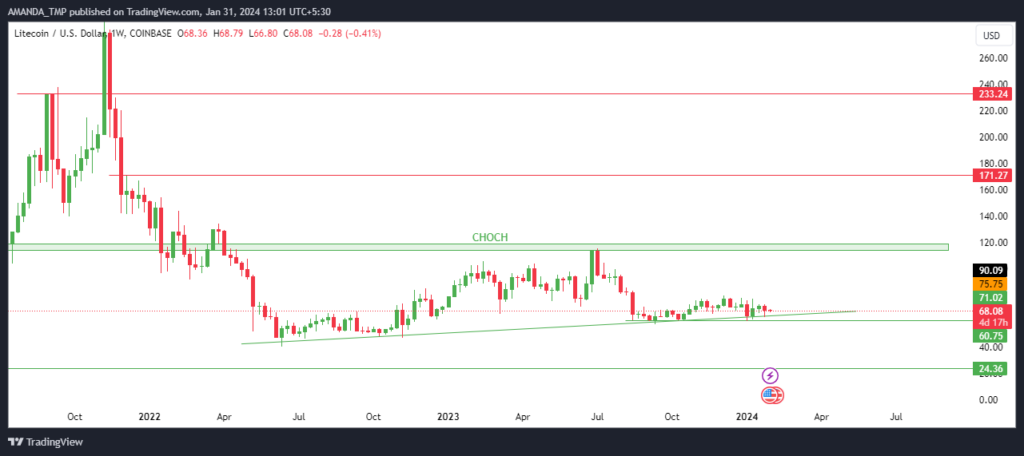
After witnessing a strong sell-off and profit booking from the higher levels, the LTC price is currently slowly rising to higher levels. This behavior of the price has led to the formation of dynamic support.
If the price of the LTC crypto sustains the support level and bounces to the higher levels, we might see a continuation in the rising momentum of the price.
LTC/USD Chart by TradingView
On the daily timeframe, the LTC crypto price indicates weakness as the price of the crypto has declined below the crucial EMAs. Additionally, the 50-day and the 200-day EMAs are forming a death cross.
Looking at the MACD indicator, the MACD and the signal lines overlap each other below the zero level.
From the overbought zones, the RSI has declined below the 50 level, showing declining momentum in the price. Moreover, the RSI line has overlapped the 14-day SMA line and for the reversal in the trend, the RSI will have to sustain above the 50 level.
Summary
The LTC price has fallen below key EMAs and shows weakness on the MACD and RSI indicators. The market cap, trading volume, and TVL of Litecoin are also declining. Litecoin may not sustain the dynamic support and may go on to hit new highs.
Disclaimer
This article is for informational purposes only and does not provide any financial, investment, or other advice. The author or any people mentioned in this article are not responsible for any financial loss that may occur from investing in or trading. Please do your research before making any financial decisions.




