
 Pearl
Pearl Ondo
Ondo Ethereum
 Bitway
 Derive
 Pudgy Penguins
 NEAR Protocol
- The DOT crypto price is locked in a small consolidation zone.
- Polkadot has witnessed a decline in its trading volume over the last 24 hours.
Polkadot is a “blockchain of blockchains,” enabling custom blockchains (parachains) to operate on its relay chain.
Launched in 2020, it facilitates secure, decentralized transactions and supports smart contracts via connected chains.
Its native token, DOT, is used for governance, staking, and securing parachain slots. Founded by Gavin Wood and others, it is maintained by the Web3 Foundation.
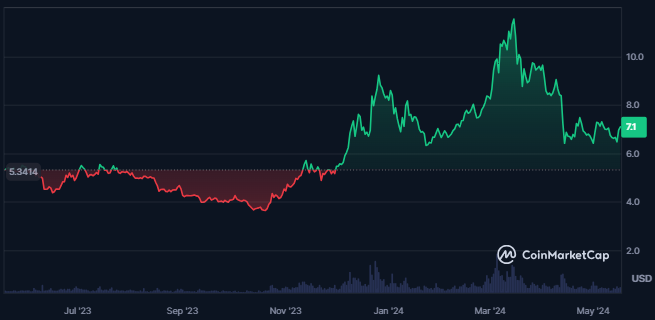
The traded volume of the Polkadot crypto has witnessed a decline of 19.4% over the last 24 hours from the time of writing. It showed a decline in traders’ activity in the crypto.
Also, the value of the traded volume of the crypto is $204.371M and the volume ranking of the crypto in the global market is #47. This is further followed by a volume/market cap ratio of 2.0%.
The market cap of the Polkadot has been trading flat over the last 24 hours and has slightly advanced by 1.95%. This further results in a market cap value of $10.231B, which makes it the 14th largest cryptocurrency.
Moreover, the maximum supply of Polkadot is infinite, while its circulating supply and maximum supply are the same. This results in 1.437B DOT and a fully diluted market cap of $10.244B.
Polkadot Crypto Derivatives Data Overview
A higher short liquidation in Polkadot was recorded in the last 24 hours. That has resulted in a value of $121.47K, against which the long liquidation is worth $82.19K.
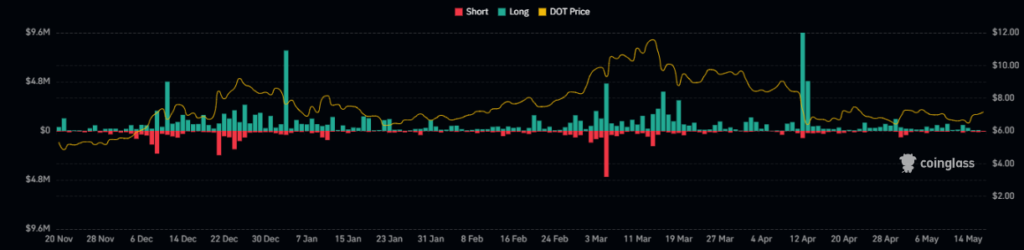
The long/short ratio of the Polkadot crypto is 1.0606, and the derivatives volume has declined by 25.07% in the last 24 hours from press time. The open interest has further witnessed a slight advance of 0.94%.
Moreover, the value of the derivatives traded volume of the crypto is $240.10M, and the open interest of the crypto is valued at $265.05M.
DOT Crypto Technical Analysis
The DOT crypto price was trading inside a falling wedge pattern for a long time. The crypto price further broke out above the pattern on 01st May 2024. Since then, the price has sustained above the breakout level.
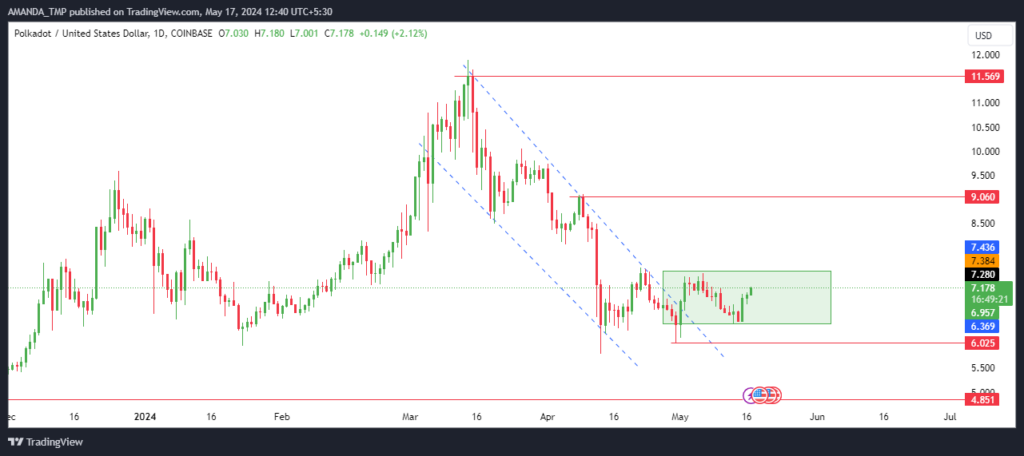
Press time price action shows that the DOT crypto price is consolidating in a small range. The higher band of the consolidation is at $7.5, and if the price breaks above the given level, it might continue to surge to higher levels.
DOT/USD Chart by TradingView
The 20-day and 200-day EMAs are trading in a death cross while the crypto price is forming bullish price action and is moving towards the 200-day EMA. If the price of crypto continues to rise, it might lead to a golden cross.
The metrics of the MACD are heading towards a bullish trajectory, followed by a bullish cross of the MACD and the signal line.
The RSI has also broken above the 14-day SMA and the 50-level. It shows bullish momentum in the trading price of the crypto.
Summary
Polkadot has broken above a falling wedge pattern, signaling potential upward movement. Despite a 19.4% decline in trading volume, DOT’s market cap has slightly risen by 1.95% and is now valued at $10.231B.
Technical indicators like the MACD and RSI suggest bullish momentum, with a target of $7.5 and higher levels ahead.
The support levels for the DOT crypto are $4.850 and $6.0, which are further followed by resistance levels of $11.5.
Disclaimer
This article is for informational purposes only and does not provide any financial, investment, or other advice. The author or any people mentioned in this article are not responsible for any financial loss that may occur from investing in or trading. Please do your research before making any financial decisions.




