astronaut
 Pearl
Pearl Hyperliquid
 Walrus
 Pudgy Penguins
 Bitcoin
 NEAR Protocol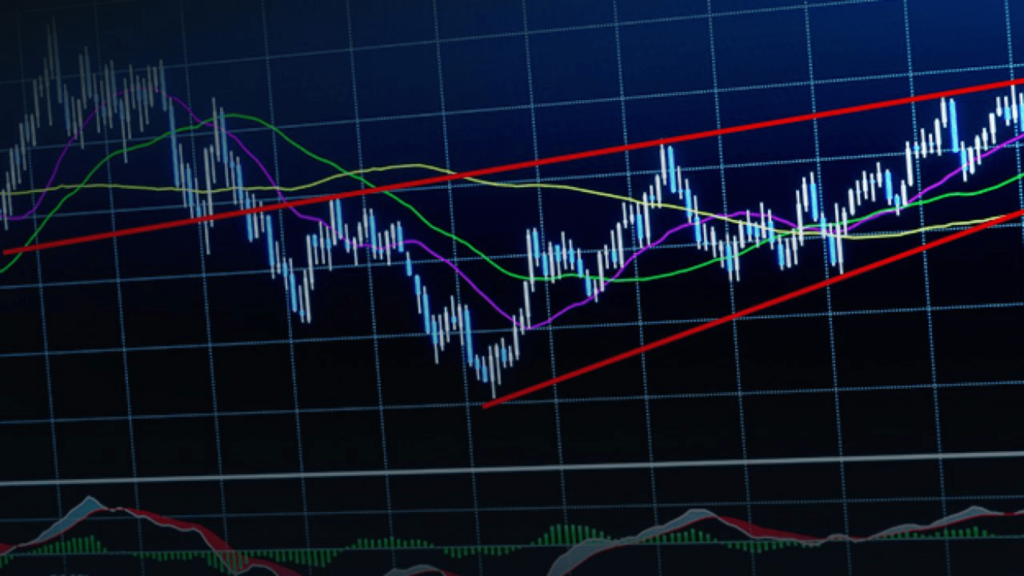
Have you ever wondered how top traders know where the market is heading? The secret is often hidden in chart patterns. These are shapes on price charts. They tell us about the possible future of prices using past data.
Chart patterns are the backbone of reading charts. To use them, traders must know shapes like head and shoulders. These shapes and learning about support and resistance give smart traders essential insights into the market.
To use these patterns well, you need to really understand the sema markets. Whether it’s a crazy or quiet market or if things look good or bad, knowing how to spot patterns can help you. Remember, these shapes are not always right. You should also use other ways to make smart choices.
Key Takeaways
- Chart patterns help us predict where the market is going.
- It’s important to spot shapes like head and shoulders, and understand support and resistance.
- Knowing the market’s conditions well is essential to using patterns effectively.
- Chart shapes are not always correct. You should use them with other tools to make the best decisions.
Understanding the Basics of Chart Patterns
Chart patterns are like maps of the stock market’s mood and movements. They show how traders might act. By looking at these patterns, traders try to guess what prices might do next. It is a big part of studying the market and making good choices.
What are Chart Patterns?
Chart patterns are shapes that show the push and pull in the market. They include things like candlestick patterns, which tell us what many traders might be thinking. Knowing these shapes can help traders make smarter moves, improving how well they do in trading.
Why Do Chart Patterns Matter?
These shapes are important because they show what many traders are feeling. By understanding them, traders can find better times to jump in or out of the market. That makes their trading plans work better. They also clue us into where the market is heading.
Key Components: Support and Resistance
Support and resistance are essential parts of chart patterns. They show where the market might slow down or change direction. These parts help traders figure out what might happen next. Getting this right is key to trading well.
| Term | Definition | Importance |
| Price Action | The movement of a security’s price. | Shows real-time sentiment and decision points. |
| Candlestick Patterns | Graphical representations of price movements within a specific period. | Provides insights into market trends and potential reversals. |
| Financial Instruments | Assets that can be traded, such as stocks, bonds, and derivatives. | Essential for diversifying and managing portfolio risks. |
| Market Analysis | The process of studying market data to forecast future price movements. | Helps in making informed trading decisions. |
| Demand and Supply | Economic forces that determine the price of financial instruments. | Key to understanding price movements and market behavior. |
Common Reversal Patterns in Trading
Reversal patterns are key for traders. They help predict changes in market direction. Knowing these signs lets traders make quick moves to boost their trading results.
Head and Shoulders
The Head and Shoulders pattern shows when a trend reversal might happen. It changes from a bullish to a bearish trend. You see a central price peak (the head) with two smaller ones (the shoulders). The line connecting the lowest points of these peaks is the neckline. If the price drops below this line, it could mean a bearish reversal. Traders watch for this to know when to enter trades that profit from a falling market.
Double Tops and Double Bottoms
The Double Tops and Double Bottoms patterns are easy to spot and effective. Double Tops are where two high points are near a top. It might mean a switch to a down-market trend if the price falls below a certain point. On the other hand, Double Bottoms suggests a switch from down to up trends. It happens if the price rises above a certain point between two low points.
Triple Tops and Triple Bottoms
Triple Tops and Triple Bottoms give very clear signs of a trend’s turning point. They show three peaks or troughs in a pattern. Triple Tops happen when three high points line up. They suggest a turning to a down-market trend when a specific limit is broken. On the other hand, Triple Bottoms shows a turning to an up-trend. That’s if the price goes over a certain point between three low points. These show a strong turning sentiment in the direction the market is heading.
Continuation Patterns: Riding the Trend
Continuation patterns help me choose when to trade. They show if a trend might keep going up or down. Understanding these patterns is key to making trades that flow with the market. Let’s learn about some important signals in trends.
Ascending and Descending Triangles
When I spot an ascending triangle, I focus on its shape. It has a flat top and a bottom line that goes up. That shows a possible upward trend. It means more people might buy, pushing prices up.
If I see a descending triangle, I know it might go down. It looks like a flat bottom and a top line that decreases. It is a sign that selling could be stronger, leading prices lower.
Flags and Pennants
Flags and Pennants show up after quick price changes. They mark a short time when prices don’t change much. Flags and pennants show either a slight slowdown or a short break, but both often mean the trend will continue soon. It can be a good moment to jump in and make the most of the current trend.
| Pattern | Characteristics | Trend Indicator |
| Ascending Triangle | Horizontal resistance, ascending lows | Bullish Continuation |
| Descending Triangle | Horizontal support, descending highs | Bearish Continuation |
| Flag | Short-term regression within parallel trend lines | Continuation of current trend |
| Pennant | Converging trend lines after a sharp price move | Continuation of current trend |
Knowing these patterns helps me be smart in trading. By looking at trend directions and the highest and lowest points, I can guess if the market will keep moving in the same direction. That can lift my chances of doing well in trades.
Intermediate Patterns: Wedges and Rounding Bottoms
Wedges and rounding bottoms are cool. They help us understand how prices change. A rising wedge might mean prices will fall. A falling wedge could show that they will rise. It allows us to make smarter choices when trading.
Rounding bottoms are also neat. They hint at changes or things staying the same. They show a move from bad to good feelings in the market. When we see this pattern with others, it can tell us a lot. Plus, its shape is obvious to traders, showing a new trend might be starting.
Reading wedges and rounding bottoms takes some skill. You have to look at the big financial picture. Getting good at this can help you see the best times to trade. It makes trading better, no matter if prices are going up or down.
Disclaimer: Any information written in this press release or sponsored post does not constitute investment advice. Themarketperiodical and all its authors do not, and will not endorse any information on any company or individual on this page. Readers are encouraged to make their own research and make any actions based on their own findings and not from any content written in this press release or sponsored post. Themarketperiodical.com is and will not be responsible for any damage or loss caused directly or indirectly by the use of any content, product, or service mentioned in this press release or sponsored post.