
 Crawlerpad
 Aerodrome Finance
 Zylo Ecosystem
 Wisp
Wisp Pearl
Pearl Sonic
Sonic Quantus
- The Frax Share token price has declined by 94% from its all-time high price.
- The annual inflation rate of the FXS token is certainly high.
At press time, 95% of the token holders were at a loss, and only 3% were in profit. Also, the token’s large holders concentration was 91%, and 50% of the holders had held it for more than 1 year.
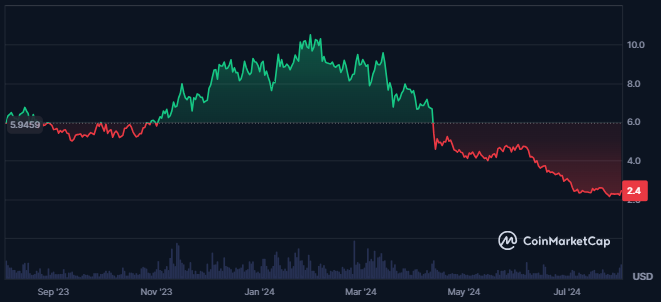
The market cap and the traded volume value for the Frax Share token increased over the last 24 hours. This showed a rise in the demand for the token among investors and traders.
The Frax Share’s market cap advanced by 10% in just 24 hours from the press time. This resulted in a market cap of $197.124M, and the token’s ranking was #229 per CoinMarketCap.
A surge of 92% in the token’s traded volume was also recorded, resulting in a traded value of $44.704M. This showed huge liquidity in the token, as 22.39% of the token’s market cap was traded.
The Frax Share price was highly volatile, followed by a volatility of 5.08%. Also, the token’s supply inflation was high, resulting in 8.94%. The token’s circulating supply was 81.045M FXS, and the token’s total supply was 99.681M FXS, resulting in a fully diluted market cap of $242.696M.
Frax Share Token Derivatives Data Analysis
The derivatives traded volume value for the FXS token also advanced by 365% in just 24 hours. This resulted in a derivatives traded value of $84.36M.
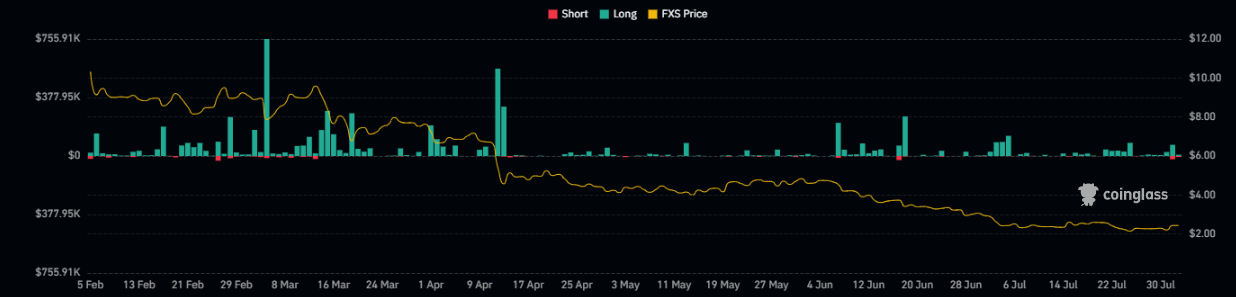
The open interest of the token also witnessed a surge of 69%, resulting in $17.02M. It showed a rise in the number of open positions in the token derivatives.
The token’s liquidation chart further showed higher long liquidations over a long time. Also, over the last 24 hours, higher longs worth $62.05K were liquidated against the shorts of $27.52K.
FXS Token Technical Analysis
FXS token price experienced a strong downtrend for the last six months, which led to a decline of more than 80% in trading price. This was followed by the formation of lower lows on the daily chart.
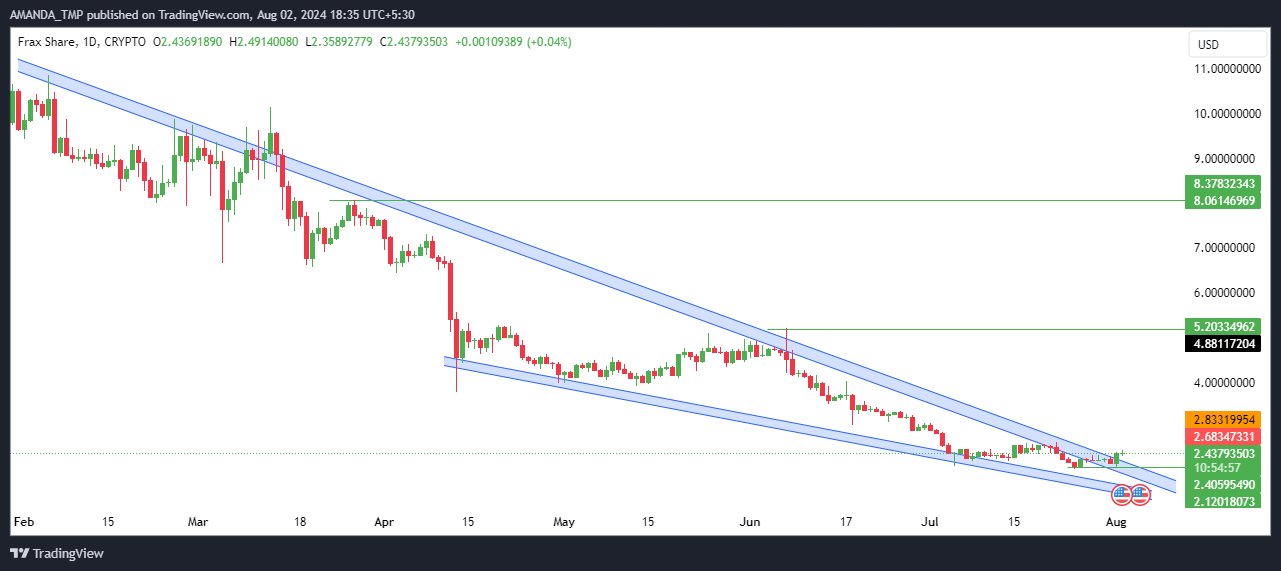
The bearish behavior of the FXS token price led to the formation of a descending triangle pattern on the daily chart. The token price has broken out above the same pattern following a green candle.
Suppose the token price is further sustained above the breakout levels, and a surge in volume is witnessed. If this occurs, a surge in the price might be seen.
Frax Share Token Technical Indicator Analysis
The 50-day and the 200-day EMAs have traded in a death cross. Additionally, the price was sustained below the same for a long time. This showed a strong downtrend in the token’s price.
FXS/USD Chart by AMANDA_TMP TradingView.com
The MACD and the signal line have traded in a golden cross, but both the metrics traded in the negative trajectory. This showed an uncertainty in the price trend.
The RSI also followed a bearish cycle and traded below the 50-level. At the time of writing, it was at a level of 47. If it further advances and sustains above the 50-level, a surge in bullish momentum of the price might be witnessed.
The support levels for the FXS token are $1.0 and $2.4, followed by the resistances of $5.20 and $8.00.
Disclaimer
This article is for informational purposes only and does not provide any financial, investment, or other advice. The author or any people mentioned in this article are not responsible for any financial loss that may occur from investing in or trading. Please do your research before making any financial decisions.




