Universal High Income
 OnlyAgent
 Bitcoin
 Aerodrome Finance
 Pudgy Penguins
 Monero
 Sui
- The Litecoin price has triggered a breakout from a descending channel.
- Its trading volume has increased by 45% to $592.38 million.
Litecoin (LTC) price has been in a bullish trend since November and surged by 63%. Amid this bull run, the Litecoin price has experienced a correction phase. However, it has triggered a breakout from the correction and exceeded the 20-day EMA.
In 2012 and 2013, there were notable percentage increases of 150.51% and 293.61%, respectively, in the LTC price. It also experienced decreases in 2015 (-22.94%) and 2016 (-10.24%), which indicated brief lulls in activity. Keep on reading to learn about future price performances in this Litecoin news.
Litecoin Transaction Count Kept Increasing
Looking at the given chart, the LTC transaction count has kept rising. 300 million transactions was a significant milestone for Litecoin, demonstrating the network’s expansion over time. The graph showed a steady increase in transactions between 2011 and 2024, from 209,737 to 92,764,978.
With a 372.87% increase to 8,312,075 transactions in 2017, a significant recovery got underway, and subsequent years saw steady growth.
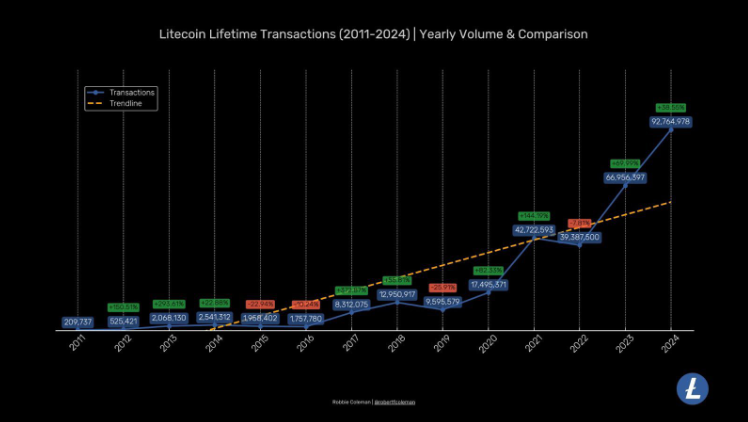
Long-term resilience was confirmed by the trendline, which showed an overall positive trajectory despite fluctuations.
A significant increase of 144.19% to 42,722,593 was recorded in 2021. After a minor decline (-7.81%) in 2022, which resulted in 39,387,500 transactions, there was a rebound, rising 69.99% to 66,956,397 in 2023.
Forecasts indicated that 2025 might continue to see growth at 92,764,978 transactions. Despite market volatility, this steady growth showed Litecoin’s potential for adoption and proved the effectiveness of its decentralized network.
Double Bottom and Breakout Noticed in the Litecoin Price
When writing, the Litecoin price was trading at $112.86. It witnessed a drop of 2.39% over the past 24 hours. The LTC coin’s market capitalization was $8.53 billion, and it ranked 22nd in the cryptocurrency market.
The LTC price took support on the $95 level and formed a double-bottom pattern. It has exceeded the 20-day EMA and has triggered a breakout from the falling channel. Suppose the price of Litecoin manages to sustain over the 20-day EMA, buyers might show interest.
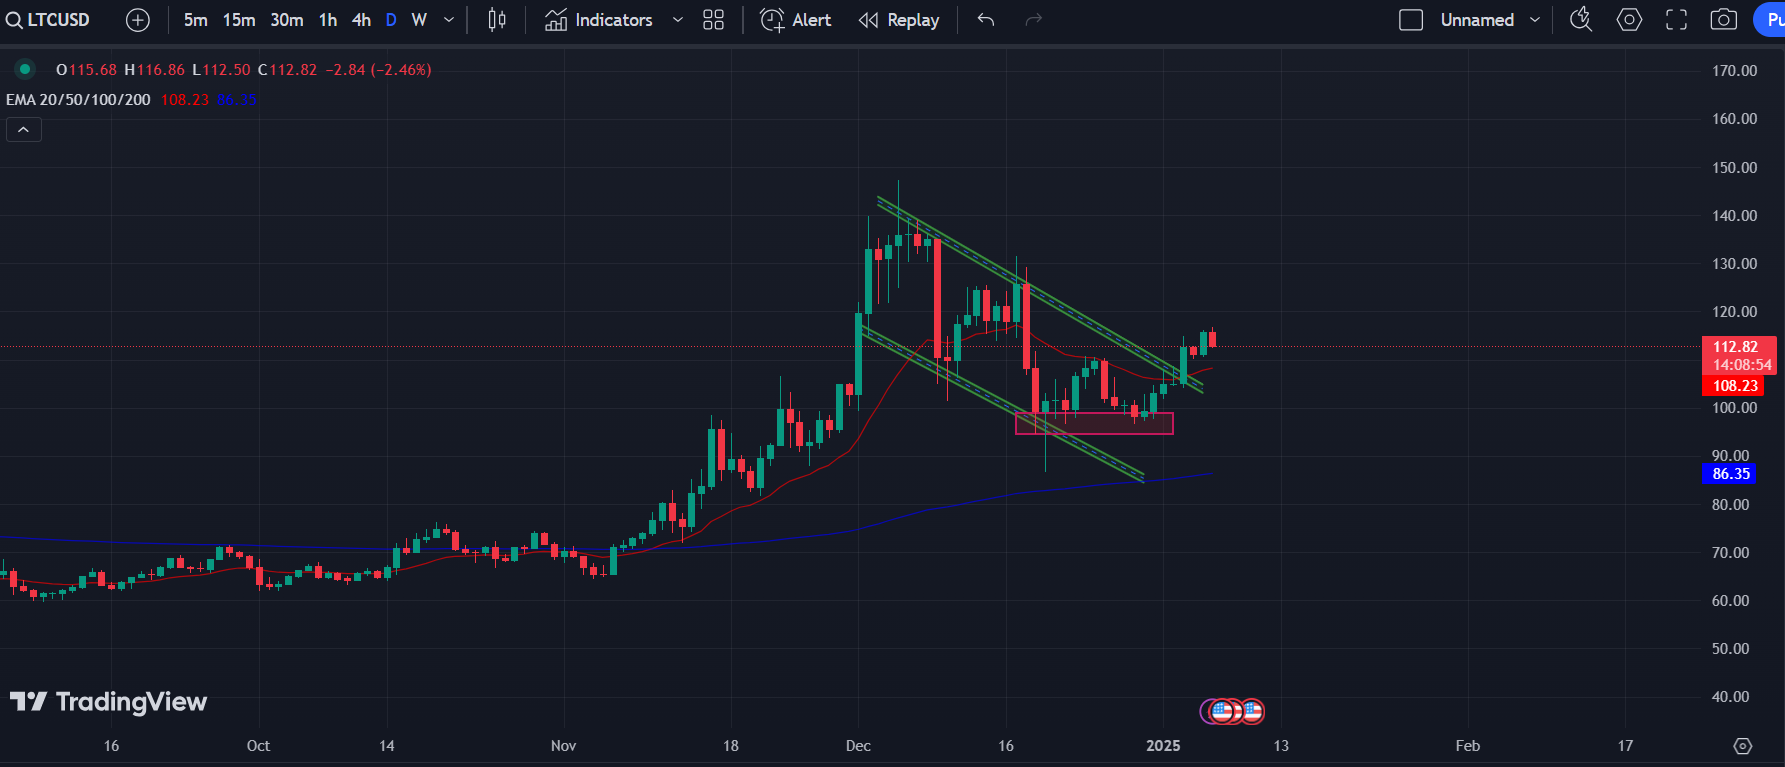
If the trading volume supports this momentum, buyers may eye for the $150 mark. The trend is bullish and has the potential to keep surging.
On the other hand, if the price of Litecoin dives below the 20-day EMA, strong selling pressure can be anticipated. Once the price loses the $100 mark, it would be a selling opportunity and a profit booking scenario can be generated.
LTC Price Overview and Its Forecast
The recent Litecoin price movements and increasing transaction volume indicate a potential bullish trend. The breakout from the descending channel and the formation of a double-bottom pattern suggest that LTC could be gearing up for a significant price surge. The $150 mark is a possible target if buyer interest remains strong and trading volume supports this momentum.
However, caution is warranted. A drop below the 20-day EMA could signal increased selling pressure, warranting a more cautious approach for investors. Overall, while the outlook appears optimistic, market volatility always poses a risk that should be carefully considered.
Disclaimer
This article is for informational purposes only and provides no financial, investment, or other advice. The author or any people mentioned in this article are not responsible for any financial loss that may occur from investing in or trading. Please do your research before making any financial decisions.