Universal High Income
 Irys
 Dacity Coin
 Bitcoin
 Pudgy Penguins
 Starknet
 Pepe
- Litecoin price has advanced by 40% in the past four days.
- RSI has displayed a golden crossover with the RSI-based moving average.
- The trading volume has increased by 65% to $2.83 Billion.
Litecoin (LTC) price has been in a bullish trend on the wider time frame. This bullish trend was halted near the $135 mark in the first week of December. After consolidating through the week, buyers lost their grip and started falling. LTC price has been facing resistance from a descending trendline. However, the price broke out from the triangle and witnessed a sharp rally.
Litecoin price has been defending the major support level of $95. However, the price has departed from this territory and reached the previous swing high. Based on the chart, the price has covered the last 40 days’ loss in just 4 days.
Litecoin ETF Approval Overview
The next big cryptocurrency to get regulatory approval for ETFs may be Litecoin. According to reports, the Nasdaq Stock Market filed a 19b-4 with the SEC not long ago. The Canary Litecoin ETF is being proposed for approval in this filing.
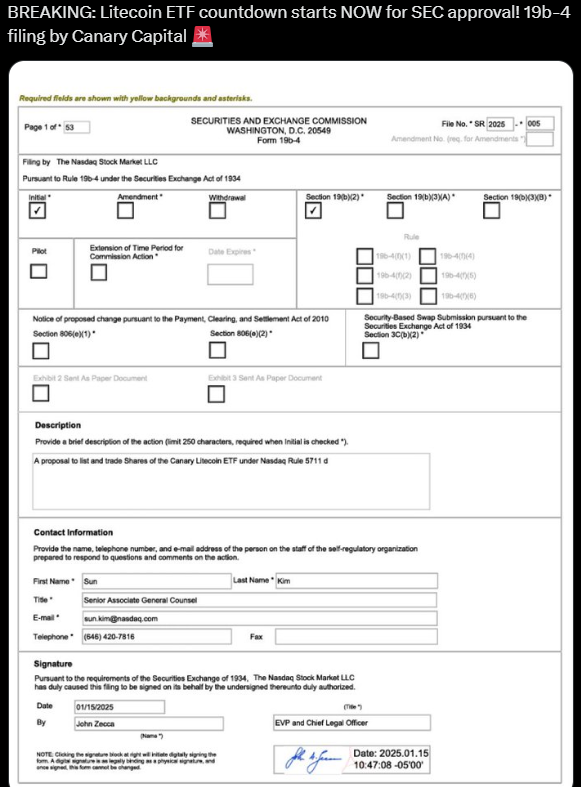
The current LTC demand may have been greatly influenced by the ETF-related development. Yesterday, the volume of Litecoin derivatives increased by 577.76% to $3.70 Billion, according to Coinglass.
LTC Price Analysis Post Breakout
When writing, Litecoin crypto was trading at $138.18 which is up by 11.35% over the past 24 hours. It’s market capitalization was $10.41 Billion and ranks 19th in the cryptocurrency market.
Based on the technical chart, the price has formed a descending triangle on a daily time frame. It has displayed a breakout from the triangle and has surged by 40%. Amid this rally, the price has reached the previous resistance zone of $135.
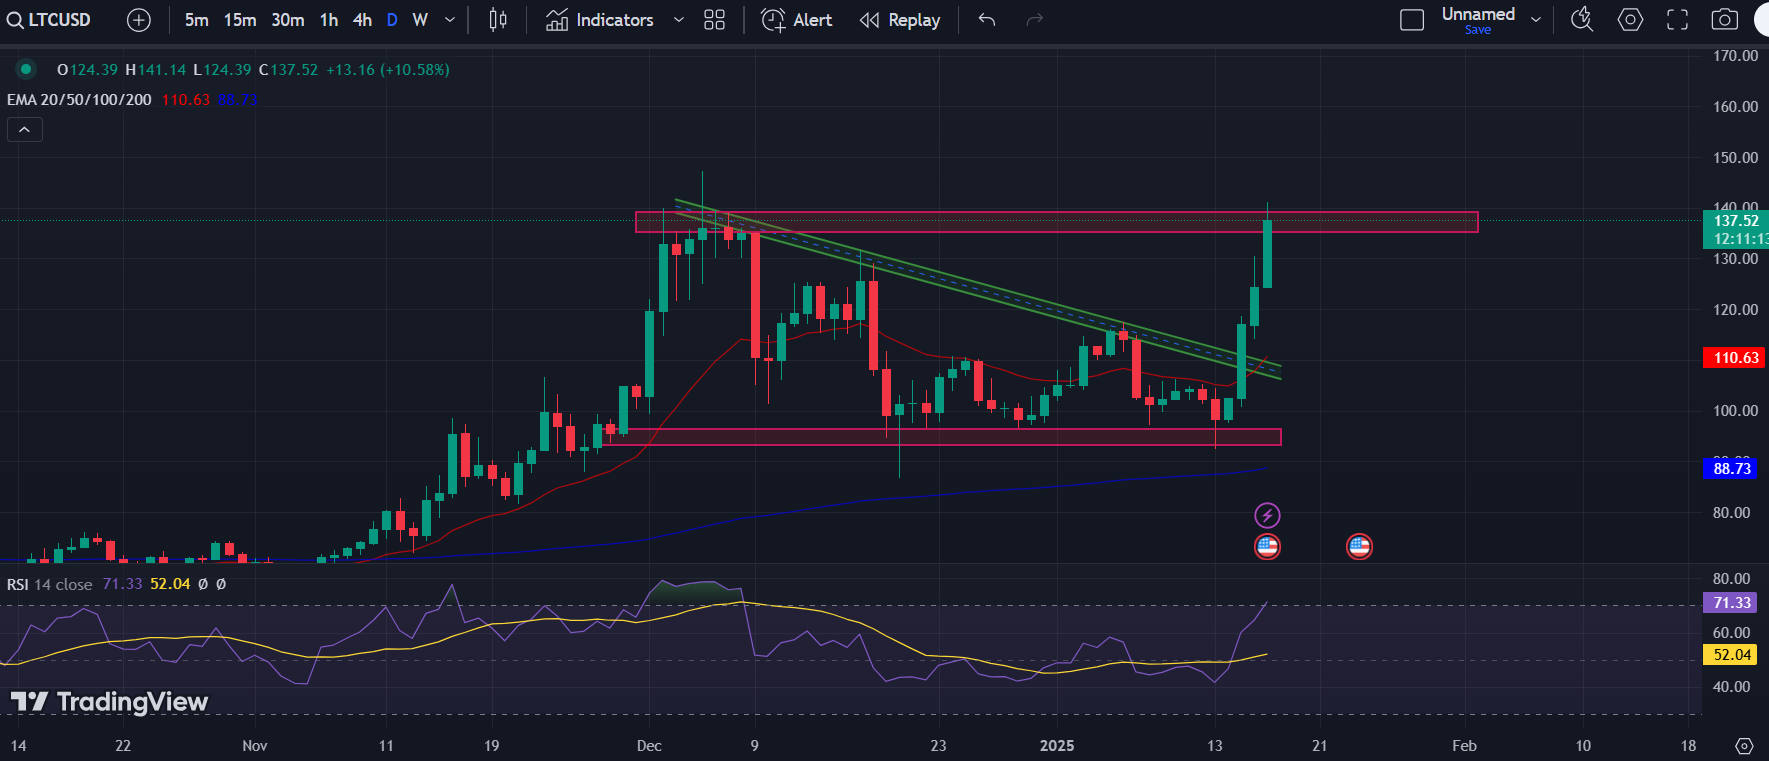
The current crypto market sentiment is bullish. If the price breaks out from the $135 mark, buyers might become more confident. If the chart structure attracts more buyers, the price might trigger another bullish rally post this correction phase.
Conversely, if the LTC price faces resistance from the previous high, it could be seen as a selling opportunity. If the price forms any bearish candlestick in this territory, sellers might show up boldly. If sellers dominate buyers, the price may melt to the major support level of $95.
Turning to the technical indicators, the RSI has developed a golden crossover with the RSI-based moving average. This might attract buyers and a bullish momentum could be anticipated.
LTC Price Analysis and ETF Filing
Litecoin has demonstrated a significant bullish momentum, with a recent surge of 40% in just four days, largely driven by the anticipation surrounding the potential approval of a Litecoin ETF by the SEC. The increase in trading volume and the emergence of a golden crossover in the RSI indicate strong market interest and bullish sentiment.
While the price is currently at a key resistance level of around $135, a successful breakout could facilitate upward momentum. However, if the price encounters resistance and begins to decline, it may present a selling opportunity, especially if bearish candlestick patterns emerge.
Disclaimer
This article is for informational purposes only and provides no financial, investment, or other advice. The author or any people mentioned in this article are not responsible for any financial loss that may occur from investing in or trading. Please do your research before making any financial decisions.