Minter
 Quack AI
 Starknet
 NEAR Protocol
 Sui
Sui Hyperliquid
 Bittensor
- As the overall market capitalization of the altcoins reaches $170B marks and looking to gain further positive momentum, the investment focus in the market is also shifting
- As the altcoins have started taking control over the overall market conditions and giving the bullish performance, here are some of the altcoins which are having the potential of the profitable bargain for the investors
Litecoin (LTC)
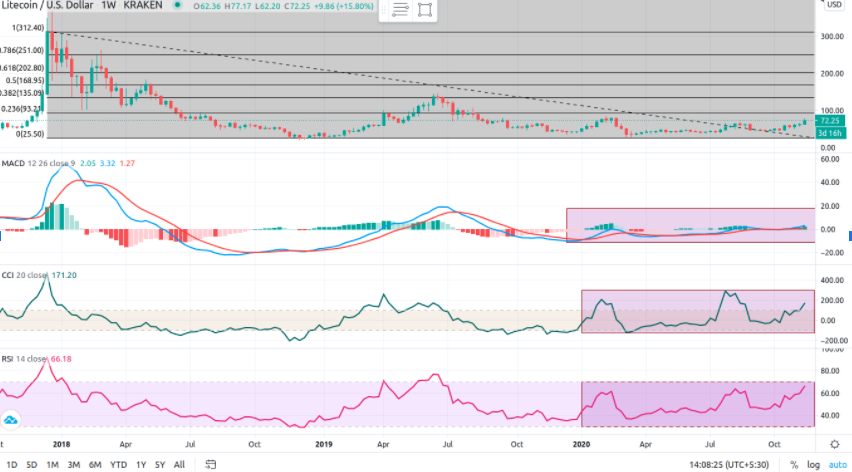
Litecoin over the yearly chart gave a positive breakout after clearing the levels of August 2020 ($68.95). The resistance on the higher side is placed at $83.70 and $92.50. On the long term charts, the significant resistance is rated at fib 0.382 ($135) while on the downside the strong support is placed at $39, which is kept in the minds of inventors.
The Relative Strength Index (RSI) is currently trading at the level of 66.54, which is near the overbought zone indicating the bullish momentum in it, now heading towards the overbought zone.
The Commodity Channel Index (CCI) after corrected from the overbought zone and now trading towards the overbought zone, currently trading at +177.80 CCI levels.
The Moving Average Convergence & Divergence (MACD) gives a positive crossover by suppressing the Bear’s line (red) by the Bull’s line (blue) indicating the positive momentum, in the coming trading sessions.
Polkadot (DOT)
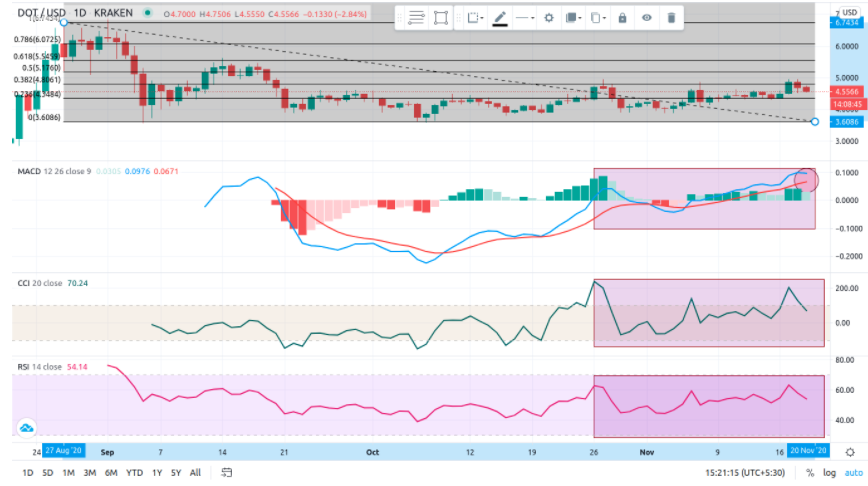
On the monthly chart, Polkadot makes a sequence of higher top and lower bottom, indicating the positive trend in it. The significant supports are placed on the downside at $3.90 and $3.60, and on the higher side, the resistance is at $4.92 and $5.45. The investors are advised at wait for the entry levels on the corrections till $4.25-$4.00.
The Relative Strength Index (RSI) is currently trading at the level of 54.80; however, after testing the overbought zone gets corrected and heading towards an oversold zone.
The Moving Average Convergence & Divergence (MACD) after a positive crossover heading parallel to the Bear’s line (red), however, now running for the negative crossover in the coming trading sessions as Bull’s line (blue) heading towards the red line.
The Commodity Channel Index (CCI) after testing the oversold zone corrects and heading for the oversold zone, currently trading at +77.93
Chainlink (LINK)
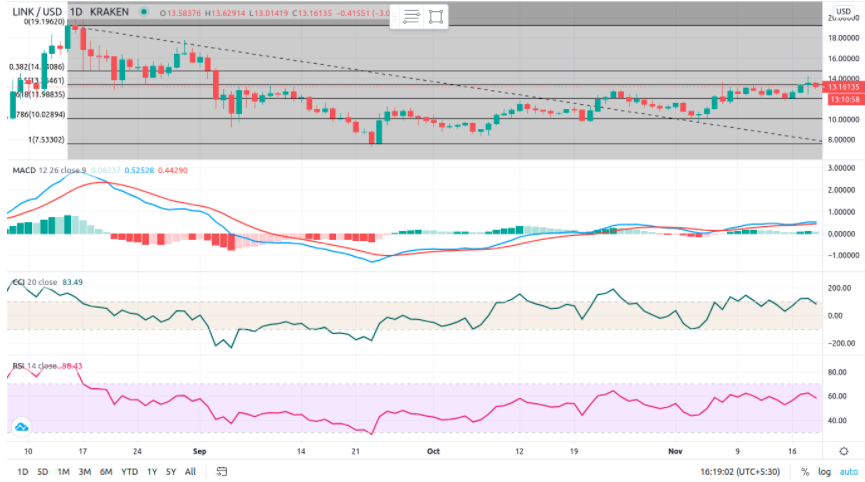
Chainlink on the yearly chart makes the bullish pattern as making the higher top and lower bottom indicating the bullish momentum in it, heading for the target of $14.75 and $16.75, while on the other hand the supports are placed $11.95 and $10.05.
The Relative Strength Index (RSI) is trading in the normal zone and currently heading for the oversold zone presently trading at 60.06.
The Moving Average Convergence & Divergence (MACD) after a positive crossover continuously indicating the bullish nature of the coin with no sign of the correction.
The Commodity Channel Index (CCI) is trading at +97.31 gets corrected from the overbought zone now heading for the oversold zone.
OMG Network (OMG)
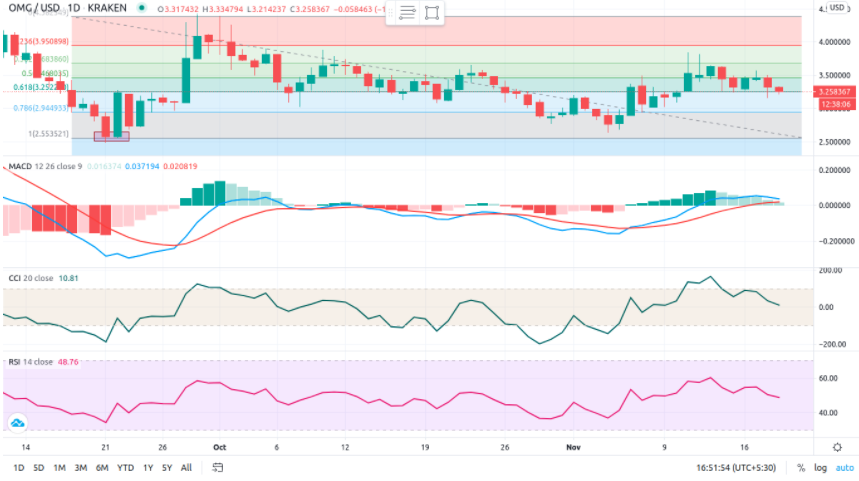
Omg network is trading sideways, but it has potential for the higher levels in the coming trading sessions the levels to keep in the minds. The resistance is placed at $3.925 and $4.430 while the supports are set at $2.945 and $2.555. The coin in the coming days
Can test the targets of $5.16 and $6.52.
The Relative Strength Index (RSI) is trading at the lower and heading towards the oversold zone currently trading at 48.58 can be considered as the positive for long term.
The Moving Average Convergence & Divergence (MACD) after a positive crossover it heading towards the negative crossover indicating the short term correction it.
The Commodity Channel Index (CCI) is trading at +10.81, which is neutral for it as after correction from the overbought zone and heading towards the oversold zone.