Pearl
Pearl ZKsync
 Bitcoin
 Starknet
 Quantus
 Puffer
 Lighter
- GRT coin price is currently observing a bearish trend in the daily chart and can soon hit a new low in the future..In contrast, the coin is up by more than 1.6% in the intraday session.
- The Graph price technical indicators suggest a bearish momentum in the price for the future. Meanwhile, GRT/BTC pair has seen a gain of more than 4.6% in the past 24 hours.
GRT crypto market dominance along with its market cap is observing a bearish downtrend in the daily chart and can soon see a new high. The asset price has to go more than 65% from its current level to break its ATH. The volume to market cap ratio of the GRT is currently near 0.11, and if the ratio jumps over 0.9 then a strong bullish trend can be seen.
Why Invest In GRT Crypto?
GRT crypto price is currently seeing a correction in the daily chart and can soon hit a new low in the future. The Graph price has seen a gain of more than 3% in the past 24 hours and is trading near the value of $0.95. The Graph is a blockchain-powered indexing protocol whose platform is mainly used for querying data in the networks like Ethereum and IPFS. The platform has seen many uses in operating various applications in both Defi and the broader Web3 servers. The graph project hopes towards bringing reliable decentralized public infrastructure to the daily users. One can forecast a strong upside momentum in assets in the upcoming days.
Technical Indicators Of GRT Crypto Price Suggests A Bearish Trend In Price
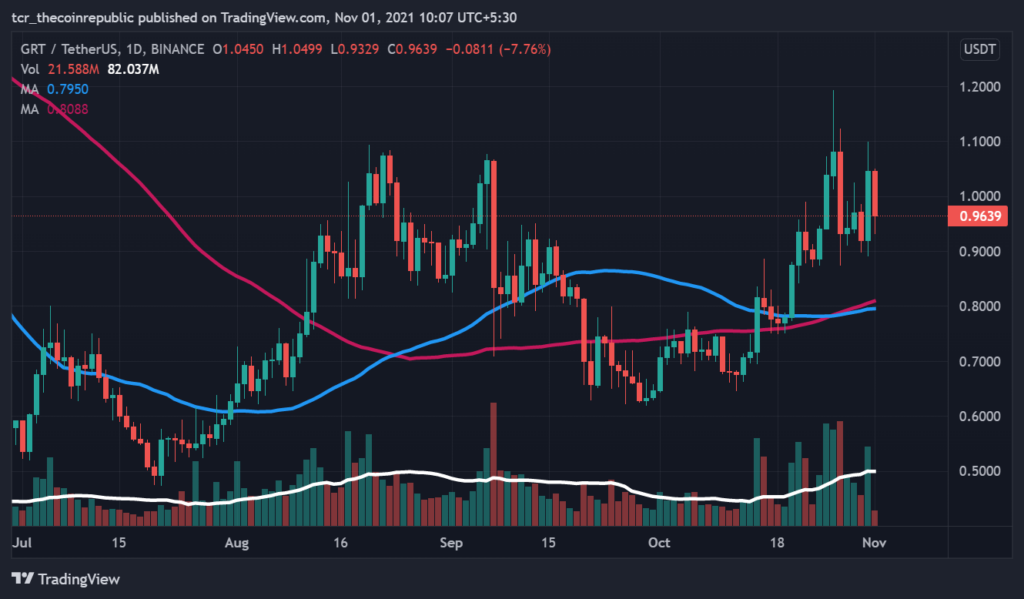
The weekly technical chart of The Graph suggests a consolidated momentum in the price for upcoming days. Coming to the daily chart, the GRT price is currently trading above the 50 and 100 MA, with a positive crossover. The 100 MA(Red) line is at $0.79, making it a temporary support region for the price. The resistance zone for the asset can be seen near $1.5. While on the downside, the asset price can see support near $0.8.There is a formation of a strong supply zone in the daily chart. If the price of the asset jumps 15 to 20% above the current level then a strong upside momentum can be seen. GRT/BTC pair can also see a new upside momentum in the future.
Conclusion
GRT coin price is currently seeing a strong upside momentum and can soon see a new high..GRT/BTC pair can also observe a new high in the future.
.
Technical Levels
Major Support:$0.5
Major Resistance:$1.5