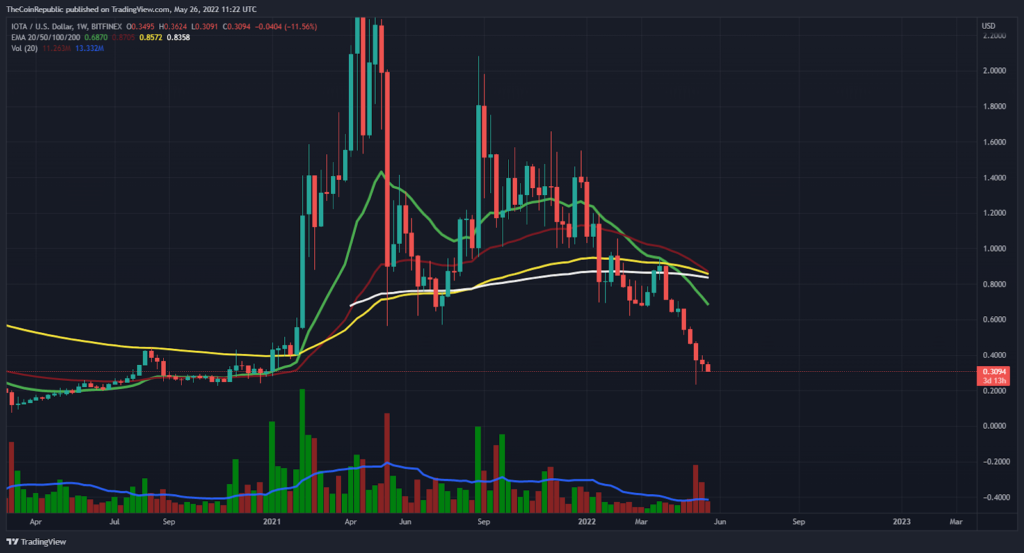
- IOTA price has lost 47% of its market cap in a month. MIOTA is going through a rigorous selling pressure over the weekly chart.
- The crypto asset has declined below 20, 50, 100 and 200-days Daily Moving Average.
- The pair of MIOTA/BTC is at 0.00001075 BTC with an intraday drop of 3.09%.
IOTA price is trading with a strong bearish trend over the chart. The token must attract more buyers to gather support from the bulls to gain the uptrend momentum over the daily chart. Volume change can be seen gradually falling and needs to grow for IOTA to surge over the chart. IOTA investors need to wait for any directional change to conclude anything about the token’s price change. Bulls are now accumulating in the intraday trading session however, it’s not up to the mark and beras may strike in the long run.
IOTA price is presently CMP at $0.31 and has lost 6.56% of its market capitalization in the last 24-hour period. However, trading volume has increased by 21% in the intraday trading session. This shows that buyers are getting attracted towards IOTA but in less amount. Volume to market cap ratio is 0.02782.

MIOTA coin price is trading with downtrend momentum over the weekly chart. This bearish rally over the long term view showcases that MIOTA falters to gain stability over the chart. Gradually, volume change signifies the token’s fall and closing candles of week are red signifying more selling then buying throughout the week.
Support at the lower end is at $0.25 and resistance on the higher side is at $0.50.
Bleeding Chart of IOTA: What do Technical Indicators Speculate?

Source: MIOTA/USD by TardingView
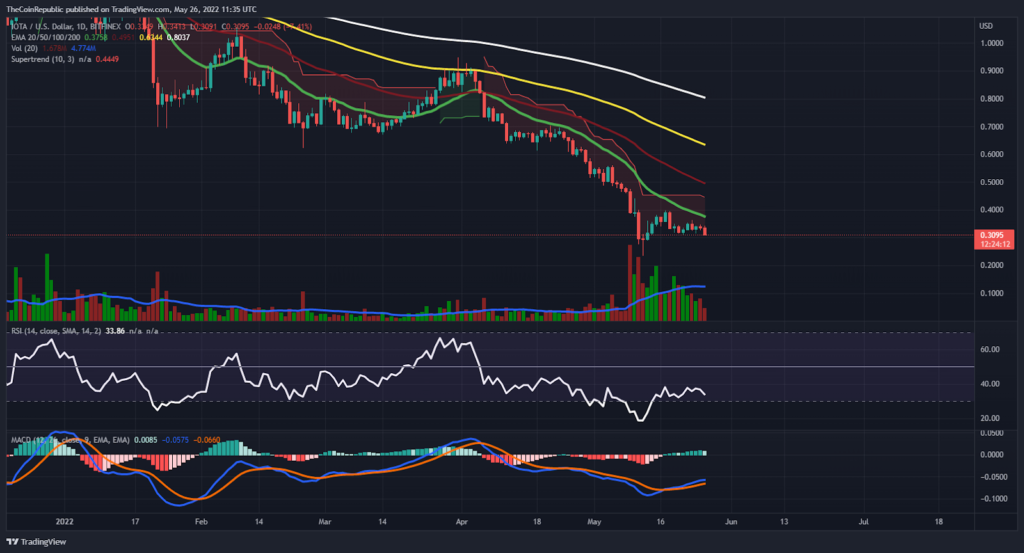
MIOTA token is falling also over the daily chart. The token must gain support from the buyers and stop falling over the chart. Technical Indicators suggest the bearish momentum of the MIOTA token. Supertrend confirms the bearish rally of MIOTA.
MIOTA went into the bearish rally from April and has been falling since then. MIOTA fell below $1.00 psychological level and must get over it to prove its existence among the reputed crypto assets. As soon as the token breaks out of $0.50 level then MIOTA investors may get some hopes of the token’s recovery above $1.00 afterwards.
Relative Strength Index showcases that MIOTA is heading towards the oversold territory. MACD exhibits the negative sign for MIOTA coin. The MACD line is heading towards the signal line for a negative crossover.
Conclusion
IOTA price is trading with a strong bearish trend over the chart. The token must attract more buyers to gather support from the bulls to gain the uptrend momentum over the daily chart. Technical Indicators suggest the bearish momentum of the MIOTA token. As soon as the token breaks out of $0.50 level then MIOTA investors may get some hopes of the token’s recovery above $1.00 afterwards.
Technical Levels
Support Levels: $0.25 and $0.15
Resistance Levels: $0.50 and $1.00
Disclaimer
The views and opinions stated by the author, or any people named in this article, are for informational ideas only, and they do not establish the financial, investment, or other advice. Investing in or trading crypto assets comes with a risk of financial loss.


