
 streamoors
 IGNITION
 Sui
Sui Quantus
 Bitcoin
 Pearl
Pearl Solana
- Graph token is forming a double bottom pattern and ready for a wild move.
- Bulls persist to hold gains and are ready to fetch higher zones.
The Graph token price shows a positive outlook from the last few trading sessions conveying bullish cues. The price is near the trendline and halted for the upcoming breakout. Moreover, conviction arises from the recent bounce from the support level of $0.1100, from which a double bottom pattern was formed, and buyers accumulated the token from there.
Furthermore, the GRT token shows a pennant pattern where the price is just on the verge of the upper neckline, and the breakout can be seen in the near-term sessions. The price action floated the positive reaction on the buyers front cues, which led to a bullish view.
The bulls are gaining traction in the last three consecutive sessions and have accumulated price by more than 8%.
When writing, the graph token trades at $0.1288 with an intraday gain of 2.77% showing bullish indications. Moreover, the pair of GRT/BTC is at 0.0000047 BTC, and the intraday trading volume increased by 4.70% to $63.61 million. The day high of GRT is $0.1304, and the day low is $0.1249. The market cap of GRT is $652.86 million.
Daily Charts of GRT token
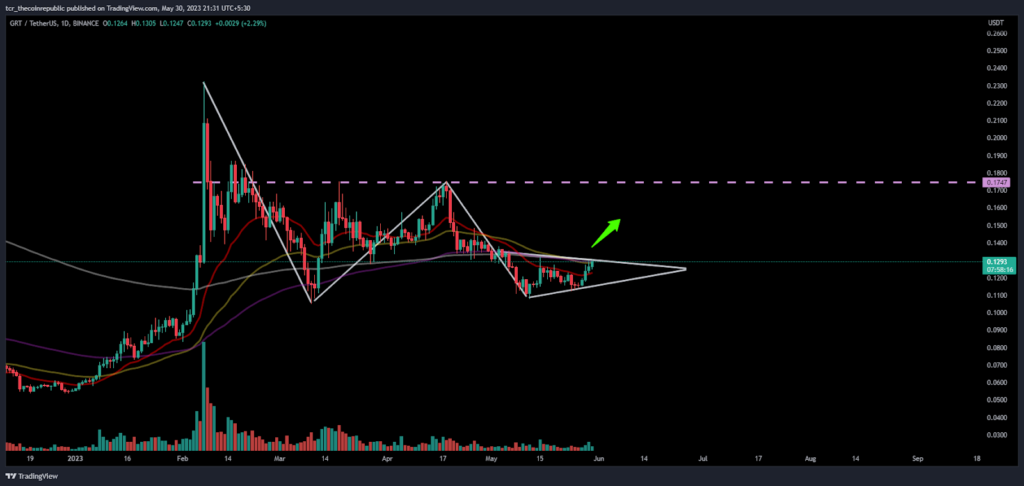
On the daily charts, the GRT token looks bullish, and when the token rides a reversal from the support mark and forms a double-bottom pattern, buyers attain momentum. Moreover, mighty bears were trapped in the past trading session and become cautious now. Bulls showed their presence and registered an up move.
Furthermore, the GRT token trades on the verge of the upper Bollinger band and near the band’s breakout and trendline. If bulls succeed in laying the move, a quick getaway can be seen with a volume surge.
Moreover, bulls are willing to escape the 50-day EMA which acts as a barrier now. After sustaining it, the bulls will raise the momentum.
What Short Term Charts Show
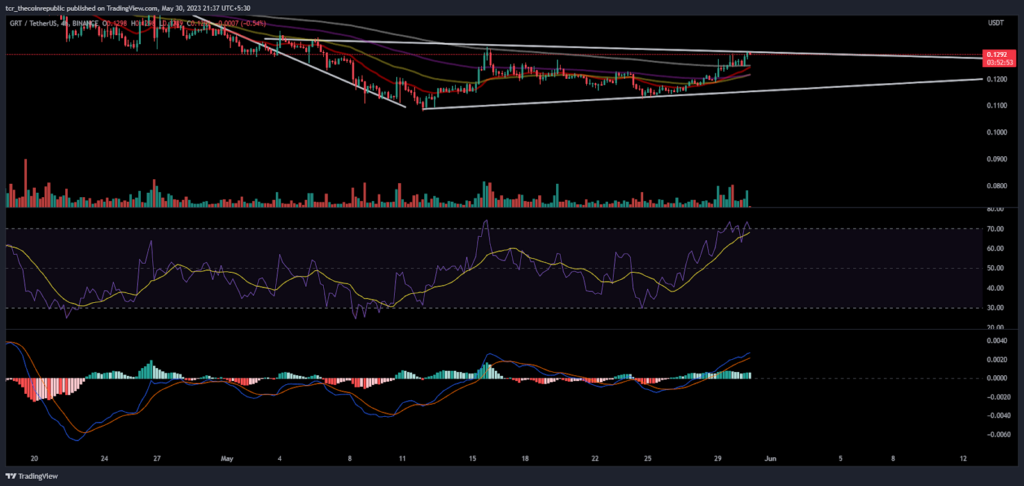
On the 4-hour charts, the GRT token is showing bullish cues with getting conviction from volumes in the intraday charts. The investors are making long positions in the token and trying to escape the congestion zone.
The price action shows fresh reversal indications, and bulls are now meeting with the gains from past trading sessions, and buyers enjoyed this handshake activity.
The RSI flew sharply above the overbought zone, indicating massive buying in the intraday session, with a positive crossover noted in the index curve.
The MACD indicator showed a bullish crossover in the past trading sessions and floated green bars on the histogram.
Conclusion:
GRT token price has maintained the gains forming a double bottom pattern and is ready for a breakout in the upcoming sessions.
Technical levels
Resistance levels: $0.1500
Support levels: $0.1000
Disclaimer
The views and opinions stated by the author, or any people named in this article, are for informational purposes only. They do not establish financial, investment, or other advice. Investing in or trading crypto assets comes with a risk of financial loss.




