
 Bitcoin
 Pearl
Pearl Starknet
 Zerebro
 NEAR Protocol
 Solana
 Quantus
- IMX token shows a surge of 2.50% intraday.
- Bulls are acquiring strength and are willing to break the neckline of $0.900.
Immutable ( IMX ) token price shows a narrow range move in the past trading sessions, forming a double bottom pattern. Last session, the breakout above the consolidation phase or cage was noted, and the token gained by more than 2% and showed a range breakout.
The price action showed an up move after a long-range bound consolidation phase, leading to a volume increase. Moreover, the trend still needed to show firm buying conviction due to the multiple resistances.
In the last session, IMX escaped the key 20-day EMA, and follow-on buying was seen in today’s session, but facing a barrier of 50-day EMA, which is not crossed by the bulls. Moreover, if it crossed anyhow, then 200-day EMA was there, which acted as a strong resistance mark.
Based on the chart scenario, after the trendline breakout, bulls gain momentum but do not move out of the cage and are stuck in a narrow range forming a double-bottom pattern. However, bulls held the range and attempted to leave the range, which was shown in the last session in the form of a marubozu candle.
When writing, the IMX token trades at $0.8063 with an intraday gain of 2.07% showing bullish indications. Moreover, the pair of IMX/BTC is at 0.0000297 BTC, and the intraday trading volume increased by 4.70% to $56.89 million. The day high of IMX is $0.8269, and the daily low is $0.7612, which shows that the token has jumped from the bottom mark. The market cap of IMX is $1.61 Billion.
Daily Charts of IMX Token
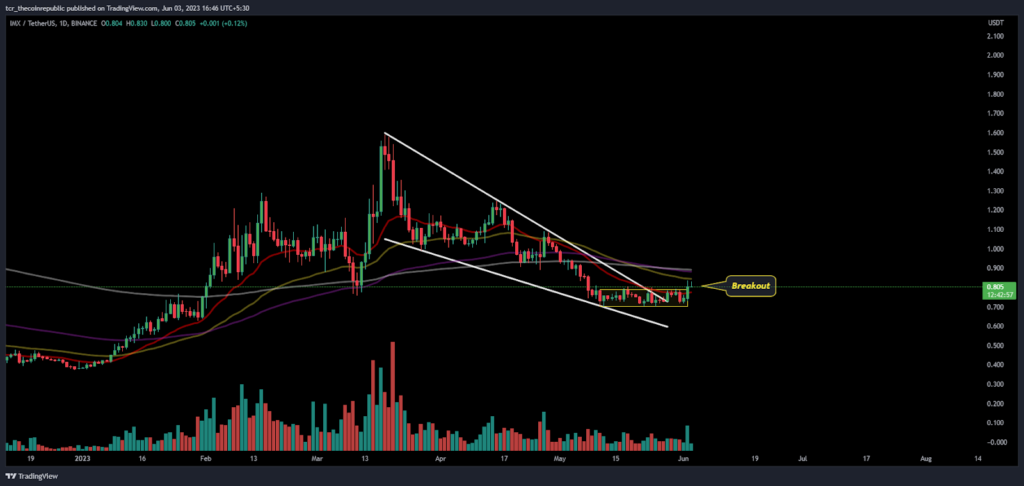
On the daily charts, the IMX token left the consolidation zone and began for an up move. The token was noted with a follow-on buying, which resumes the last session buying and sustaining above 20-day EMA.
The trajectory of the token suggests that if the token continues to surge in the next session and escapes above the 50-day EMA near $0.900, then the 200-day EMA has to be watched.
Meanwhile, if the token again retraced, then the 20-day EMA acted as a support near $0.770.
What Traditional Indicators Say?
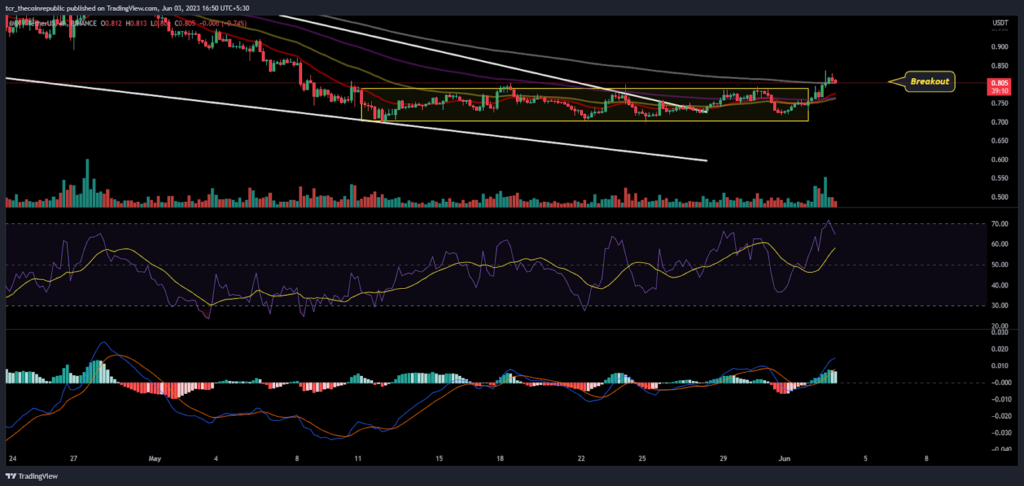
On the 4-hour charts, the IMX token showed bullish indications, and the technical parameters showed bullish ones. Furthermore, sellers will get trapped if the token continues to surge next session, and a rally can be seen.
The RSI sharply rose towards the overbought zone, and a positive crossover was noted on the index. The bullish cues were reflected based on it.
The MACD indicator also conveys the same signs of positivity, giving a bullish crossover with a full histogram graph of green bars.
Conclusion:
Immutable ( IMX ) token now looking for a new trend reversal and sustaining above the 20-day EMA gave buyers strength.
Technical Levels:
Support Levels: $0.780
Resistance Levels:$0.900
Disclaimer
The views and opinions stated by the author, or any people named in this article, are for informational purposes only and do not establish financial, investment, or other advice. Investing in or trading crypto assets comes with a risk of financial loss.




