
 streamoors
 IGNITION
 Celestia
 Injective
 Starknet
 Pearl
Pearl Quantus
- AAVE token showed a rebound from the support mark of $50.
- Buyers are worried about their long positions.
AAVE token price was noted with a breakdown in the past trading sessions and retested the strong demand zone of $50 and showed a rebound from there. The bulls were lacking their momentum and sellers looked aggressive, resulting in a price drawdown. The crucial range of $50 was defended by buyers, but mighty bears continued to put efforts to break the make or break level. AAVE needs to sustains above $50 and led the follow on buying to attain 20 day EMA to hold the neutrality.
AAVE token is now trading below the significant moving averages. Recent price action shows that a rebound from the strong mark of $50 with three white solider pattern shows signs of trend reversal . At the same time, due to lower volumes near the bottom of $55, buyers feel hopeless to stretch the gains.
When writing, AAVE is trading at $55.4 with an intraday gain of 1.45% showing neutral signs. Moreover, the trading volume was seen with an increase of 3.60%, indicating the nominal interest of investors.
In the last month, AAVE token was faced rejection from the 50-day EMA near $70 and a decline was noted breaking the 20 EMA and support of $60, then sellers gained momentum and extended the voyage and price headed the mark of $50.
Afterwards, when retested the demand zone, buyers activating the muscles and trying to rescue the gains and their presence was noted.The price action showed that the due to the breakdown of the symmetrical triangle pattern below the trendline of $70, AAVE unable to hold their and broked the support.showed on the chart.
The ongoing trend shows that if buyers will gain traction and sustain above the mark of $60, then momentum will increase in favour of bulls and will attain a 20 day EMA to stretch the gains.
Daily Charts Shows Struggling of Bulls
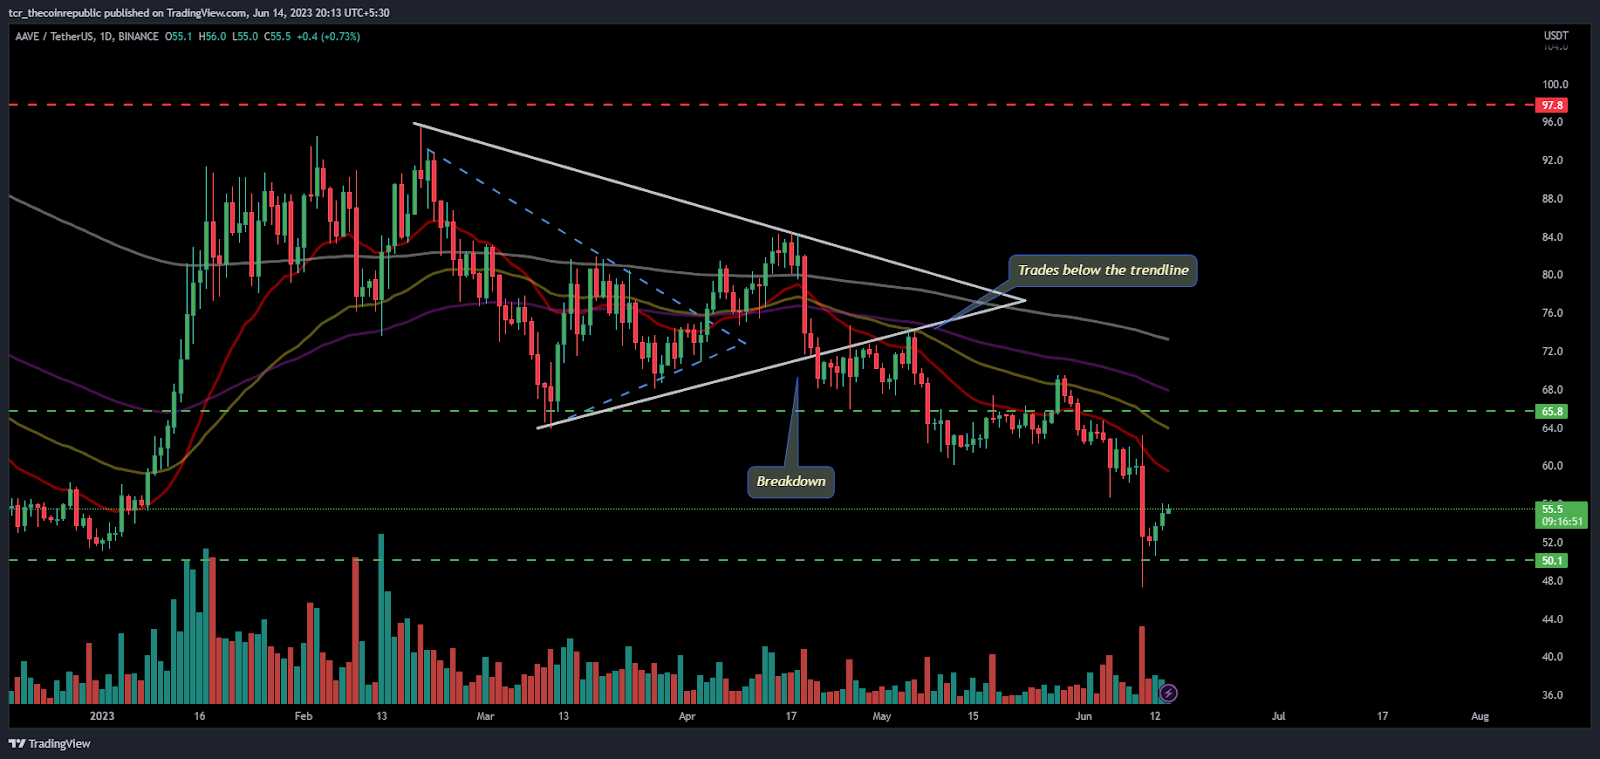
On the daily charts, AAVE token shows a volatile move in the last trading sessions and buyers were noted with a rebound from the demand zone of $50.
The Fib levels are showing that price is near to the 23.6% level and if trades above the mark then the token will hit the mark of $60 in the upcoming sessions.
What Technical Indicators Say?
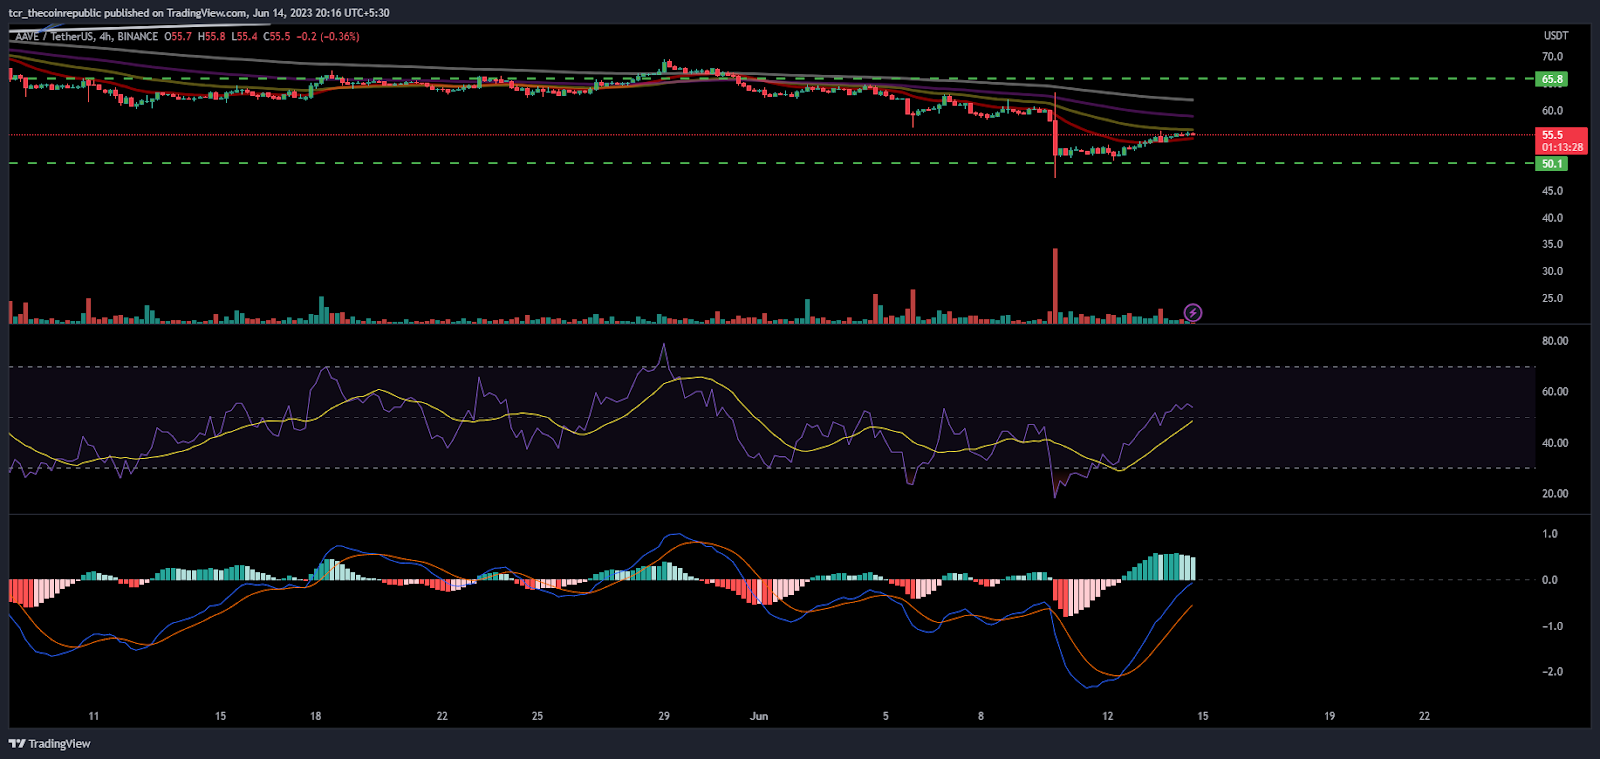
On the 4 hour charts, AAVE token showed a long bearish candle which hits the mark of $50, then after gradual up move in a kind of retracement was also noted which shows that buyers have maintained their presence and are trying to reclaim the marks near $60 and following toward $70.
The recent price formation shows that the token broke the previous month low of $66. This indicates that the token has been underperforming for the last couple of months.
The Relative Strength Index ( RSI ) curve shows a sharp recovery from the oversold region and attaining the mark of 50 shows neutrality on the charts.
The MACD indicator began green bars with a bullish crossover showing positive outlooks on the charts.
Conclusion:
AAVE token trying to gain attention of buyers and showed a gradual up move from the support of $50 and noted with a reversal ride.
Technical Levels:
Support Levels: $50
Resistance Levels: $60 and $70
Disclaimer
The views and opinions stated by the author, or any people named in this article, are for informational purposes only and do not establish financial, investment, or other advice. Investing in or trading crypto assets comes with a risk of financial loss.




