
 streamoors
 IGNITION
 Injective
 Quantus
 NEAR Protocol
 Pearl
Pearl LayerZero
- The Graph Price Prediction suggests a significant rise is possible in the long run.
- GRT Price slipped below the 50 and 200 day EMA but it did not collapse.
- The Graph crypto price is near to crucial support and buyers are trying to rebound.
The Graph Price Prediction remains bullish and suggests a significant rise is possible in the long run. However, For the short term period the GRT Price seems to be in bear grip and sellers are trying to pull it further down.
Recently, The Graph crypto displayed a death crossover and prices dropped below 50 and 200 day EMA shows positional trend is in down. But the prices did not collapse much and downfall seems to be taking halt near to $0.8000.
From, past few months GRT price seems to be consolidating in the wide range between $0.1000 to $0.1800. Buyers tried multiple times to break out of the higher range to expand upward. But, unfortunately prices got rejected due to the presence of strong sellers and were thrown back to the EMA.
In the beginning of June, GRT price formed a long tail bearish candle which triggered the negative sentiment. Later, Slow and steady Graph crypto prices declined and slipped below the lower range support which invites further decline.
The Graph Price is trading at 0.1021 with an intraday decline of -0.10%. The 24 hour volume to market cap is 3.20%.
Will Graph Price take a U-turn or decline further?
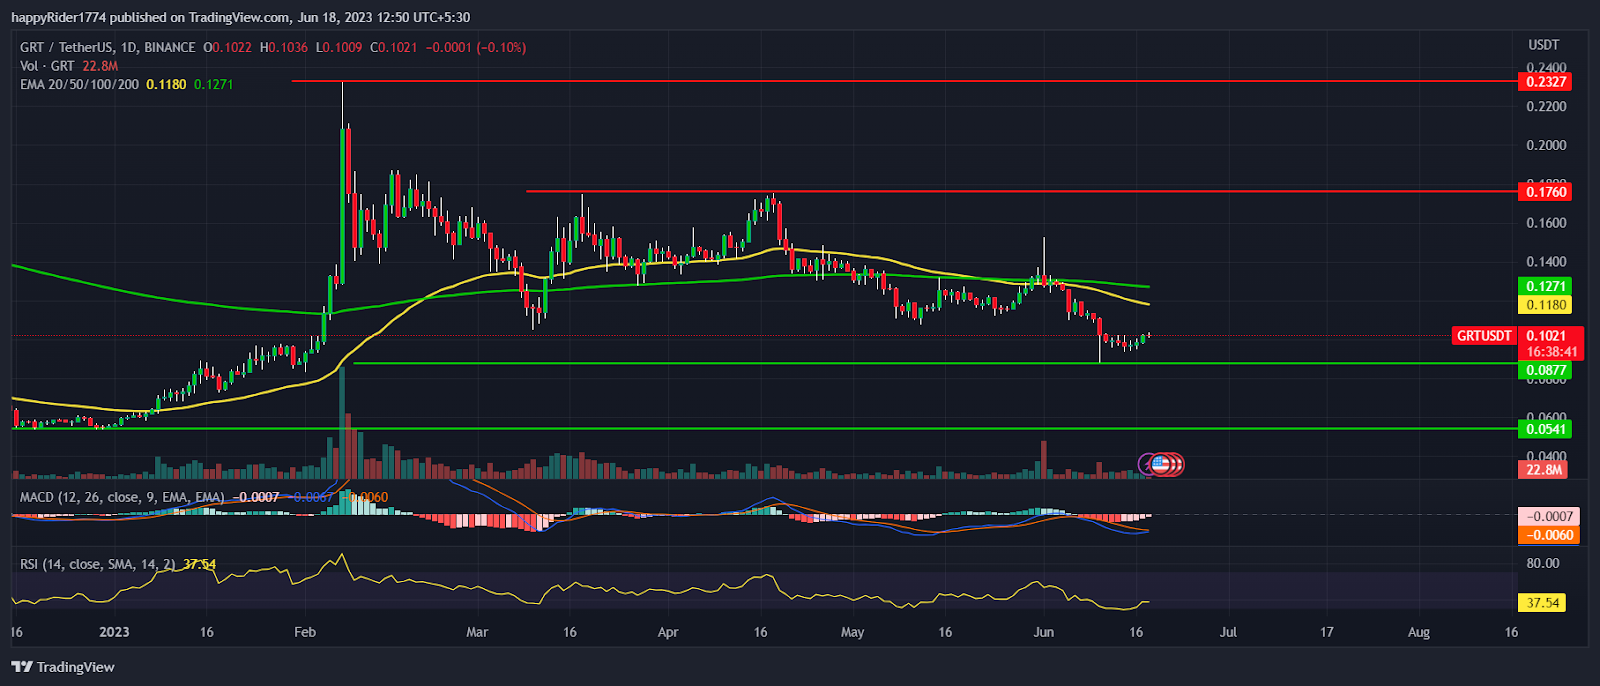
The Graph Price fell 20% in the previous week which has raised concern for the long term investors. However, the price is near to the demand zone and buyers seem to be highly active near to support.
GRT Price showed minor bounce from 0.0800 support and buyers seem to be preparing for the pull back. If the recovery continues then prices might again return back to the previous range.
Till GRT price sustains above the $0.0800 level the probability of taking U-Turn remains high. However, if prices dropped below $0.0800 then more downside will open and bear may try to drag it down to the yearly lows.
The technical analysis suggests, Graph Price is in a bear grip but due to strong support placed at lower levels the downfall might take halt.
GRT Price holds the previous week low
GRT Price formed a strong bearish engulfing candle on the weekly timeframe. Buyers look reluctant to build long positions due to fear of further downfall. However, the bulls defend the previous week lows and trying to recover the losses.
The technical indicators like MACD curve is sloping sideways indicating GRT price might consolidate for some time. The RSI at 36 denotes mild weakness and if price declines further it may test the oversold territory.
Conclusion
The Graph Price Prediction suggests a rise in the long term. However, presently the price is bear grip and buyers are trying to defend the crucial support. The technical analysis says, GRT price is near the demand zone and downfall might take halt.
Technical levels
Resistance levels: $0.1760 and $0.2327
Support levels: $0.0800 and $0.0541
Disclaimer
The views and opinions stated by the author, or any people named in this article, are for informational purposes only. They do not establish financial, investment, or other advice. Investing in or trading crypto assets comes with a risk of financial loss.




