
 Dacity Coin
 Injective
 NEAR Protocol
 Quantus
 Bitcoin
 Pearl
Pearl Sui
Sui
- BTT/USDT is down 2.48% today
- BTT/USDT is falling down for a long time and investors are uncertain of its future.
BTT(BitTorrentToken) is falling down for the past 2 years and there are absolutely no signs of recovery. Investors are losing hope as the price keeps on dropping and is creating new lows.
BTT/USDT is trading at $0.000000513 after breaking a support on the daily time frame. This drop was almost 12% from the support. The price is in a strong downtrend. The price action shows that buyers are not taking any interest. This may be because the sellers are the ones who got trapped by buying at a higher price and are selling with every rise in price to reduce their losses.
The Daily chart is showing a lack of buyers
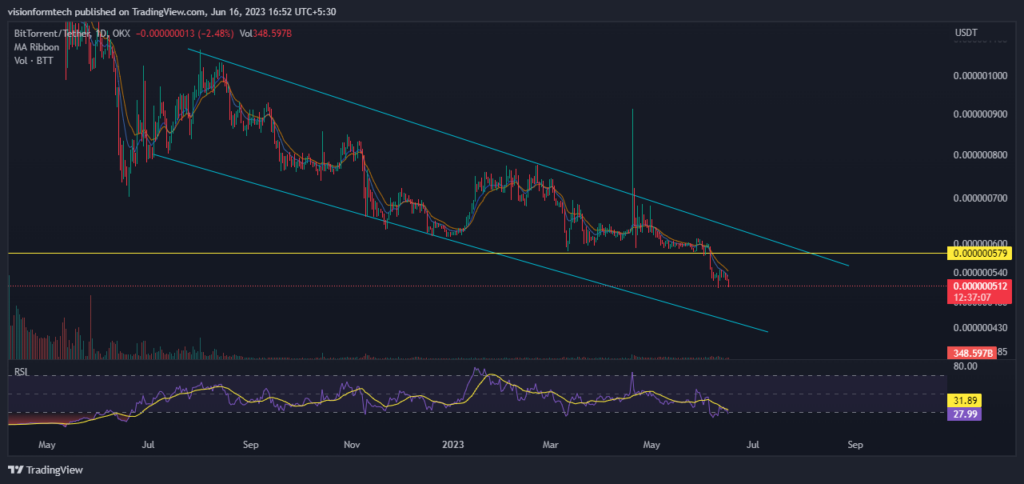
The Daily chart clearly shows that the market is missing buyers and the investors are getting worried as the day passes. From a technical point of view, we can observe a downward channel formation and this could literally be the last hope for the investors. A sustained break above this channel can send the prices up by almost 75%.
But due to this strong downtrend, this upward move is going to be quite difficult. The price can regain its strength only if the whales show interest in this asset.
The 4H chart represents a minor downtrend
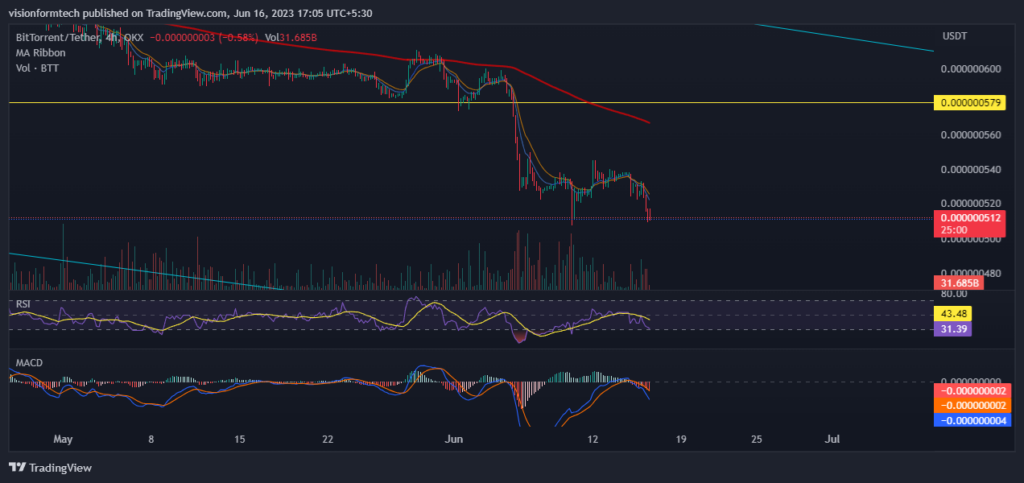
The 4H timeframe is indicating a strong downtrend as the price keeps on creating new lows. The price is below 200 EMA along with all the technical indicators pointing only in the downward direction. In case the bulls decide to show up, the price will face its first resistance at $0.000000579. On the downside, there is no horizontal support. Price can try to bounce off the trendline of the parallel channel.
As the prices fall, it will become more difficult for the bulls to push the price high as the buyers who are trapped will immediately sell as soon as they notice any surge in price . This is due to the desperation of minimizing the losses. The falling prices can also be the result weak fundamentals.
RSI: The RSI indicator is currently at 33.43 and the RSI has crossed the MA line towards the downside which indicates sell pressure.
MACD: The MACD indicator made a bearish crossover and this increases the probability of further downside.
200 EMA: As observed, on the 4hr, the price is trading below the 200 EMA(exponential moving average) which acts as a significant resistance. This is a clear indication of a downtrend where the sellers are in control and for a trend reversal, the price must break and trade above the 200 EMA.
Technical levels
Support Levels: $0.000000507 – $0.000000440
Current Price: $ $0.000000512
Resistance Levels: $ $0.000000579
Conclusion
BTT has been falling for a long time and investors are only looking to exit their positions with minimum loss. This can be seen with the drop in prices with every rise. At present, Investing in such an asset can be compared to gambling. Investors must wait for the break of the channel for any buying opportunity.
Disclaimer
This evaluation or analysis given above is only for educational and informational purposes. You should not be taken it as financial, investment, or any other trading advice. Investing and trading crypto coins comes with risk. Please consider your circumstances and risk profile before making any investment decisions.




