
 Quack AI
 NEAR Protocol
 Zcash
Zcash Celestia
 Pons
Pons Pudgy Penguins
 Bitcoin
- Walmart Stock Price (NYSE: WMT) is reversing down after hitting 52 week high.
- WMT Stock Price sustained above the 50 day and 200 day EMA showcase uptrend.
- The Walmart Inc Stock Price formed a bearish reversal pattern on a weekly time frame.
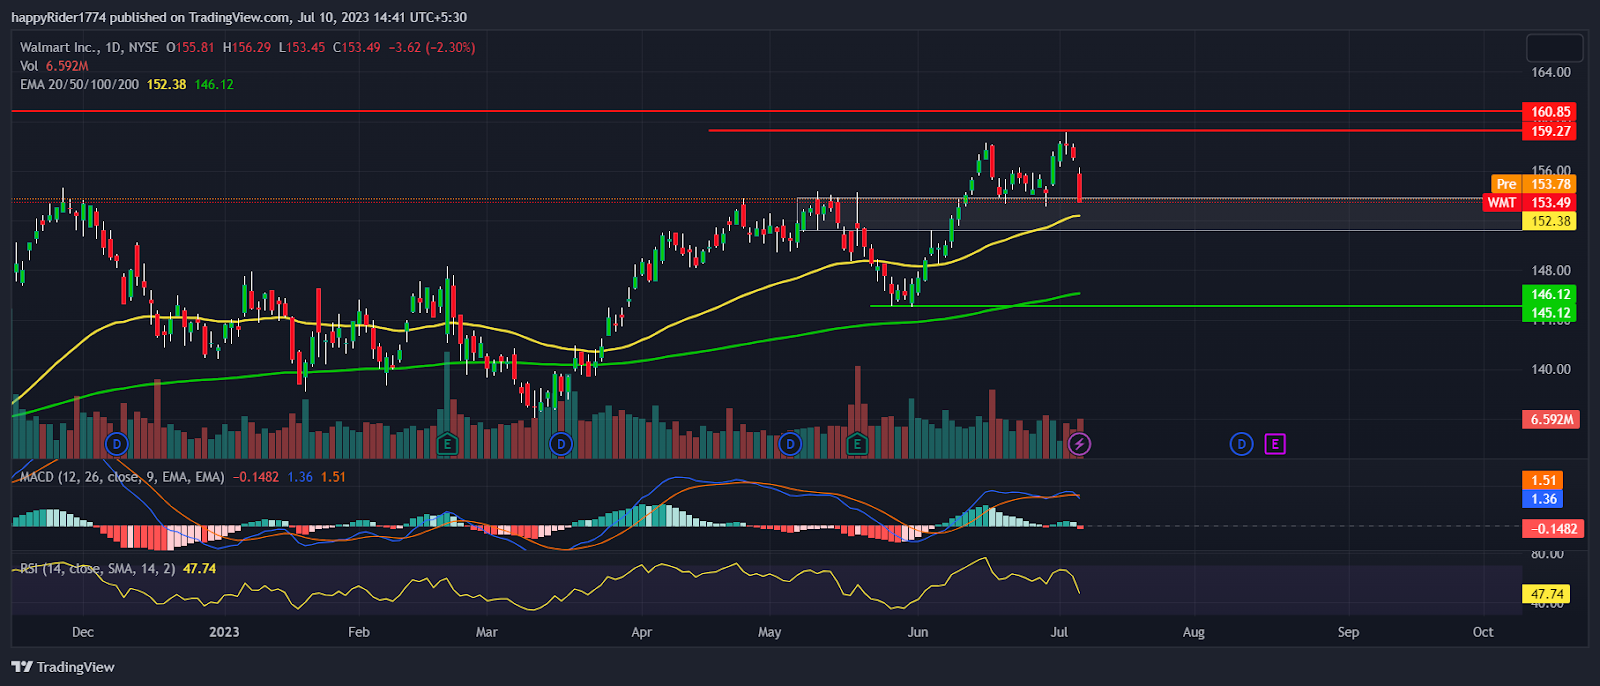
Walmart Stock Price (NYSE: WMT) fell 3.35% approx after hitting the 52 week high at $159.12. It formed a double top bearish pattern which shows the initial signs of the bearish trend reversal. However, the confirmation is still awaited.
WMT Stock Price performed well in the previous month and rallied 9% approx from the swing low. It broke out of the swing high hurdle at $154.00 which triggered the positive sentiment and created a hope for new highs. The momentum halted near $160.00 and faced minor rejection.
The WMT Stock Price re-tested the breakout level and buyers are trying their best to rebound.
Well the prices are still trading above the 50 day EMA and 200 day EMA showcases positional trend in upward direction. Therefore, any short term downmove is likely to get absorbed by the buyers at support levels.
In the past few months, Walmart Stock Price is on a slow and steady rise and generated decent returns for the long term investors. However, the trend still favors the bulls and more upward momentum is possible if the support level is defended.
Walmart Stock Price closed the previous sessions at $153.49 with an intraday decline of -2.30%. The market capitalization stands at $413.32 Billion.
Will Walmart Stock bounce back from EMAs?
Walmart Stock Price is up by 7.00% on YTD basis which is not satisfied returns. But, the prices are quite stable and speculative activities are low which makes the stock favorable for the long term pick.
Till the WMT Stock Price is sustaining above the $145.00 level the probability of bounce back remains high. Presently, the prices are cooling off after hitting a 52 week high and more downside is possible.
However, if the situation gets worse and prices drop below $145.00 then the confirmation of bearish trend reversal will be visible. The technical analysis suggests, WMT Stock Price is retracing downward but likely to bounce back from the EMAs.
WMT Stock Price Analysis on Weekly time frame
WMT Stock Price formed a strong bearish rejection candle on a weekly time frame. The sellers are active in the supply zone and trying their best to reverse the trend. The MACD curve negatively intersected with the moving average indicates prices are likely to trade with bearish bias.
The histogram bar is also turning red which also favors the bears. The RSI at 47 reversed down denotes weakness and if prices decline further then RSI will test the oversold territory soon.
Conclusion
Walmart Stock Price (NYSE: WMT) formed a double top pattern and showed signs of bearish trend reversal. But the confirmation of the trend reversal is awaited.
The technical analysis suggests, WMT Stock Price is in uptrend and short term down move will be easily absorbed by buyers.
Technical levels
Resistance levels: $160.00 and $164.00
Support levels: $150.00 and $145.00
Disclaimer
The views and opinions stated by the author, or any people named in this article, are for informational purposes only. They do not establish financial, investment, or other advice. Investing in or trading crypto assets comes with a risk of financial loss.




