
 Minter
 Quack AI
 STONK
STONK Pons
Pons Sui
Sui Pearl
Pearl Bittensor
- Qualcomm Inc. stock price is trading below the 20, 50, and 200-day Exponential Moving Average.
- Qualcomm Inc.’s stock price is currently trading at $116.87.
- Qualcomm Inc. (QCOM)’s live market cap is $130.2 Billion.
Qualcomm Inc.’s stock price is $116.87. Wireless telecommunications devices and services are designed and marketed by Qualcomm Incorporated, an American multinational semiconductor and telecommunications equipment firm. San Diego, California serves as the company’s headquarters. It was established in 1985.
Trend Analysis
After reaching a high of $193 in January 2023, the stock price of Qualcomm Inc. (QCOM) has been in a downtrend and has dropped significantly by almost 46% in the past nine months. The stock tried to reverse from the $102 support level, but it was unable to gather momentum.
Qualcomm’s stock is currently displaying a descending triangle pattern, which suggests a fragile market structure in the weekly time period. Prior to a breakout, it is advisable to take caution and hold off on purchasing the stock.
According to Simply Wall Street, Qualcomm has a large debt load given the company’s fundamentals. This substantial debt load may be viewed as a drawback, deterring potential buyers in the near future.
Additionally, a 3.9% reduction in Qualcomm’s earnings is anticipated during the following three years. Another key deterrent to the company’s investment possibilities is this.
Qualcomm Inc. (QCOM) Stock Price Analysis
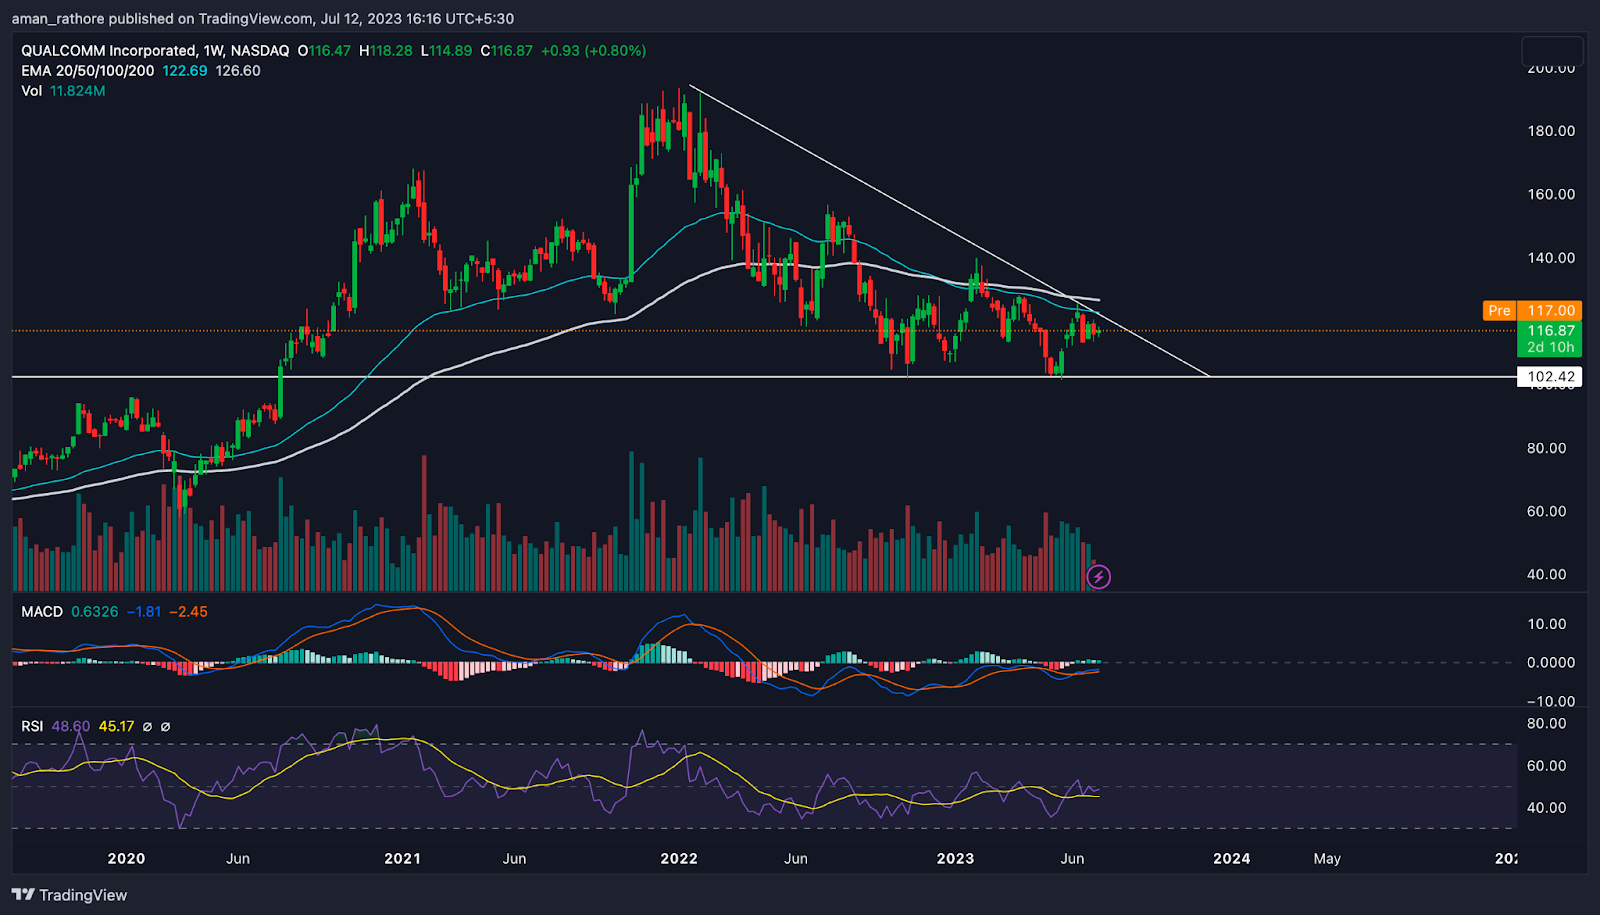
The 20, 50, and 100-day Exponential Moving Averages (EMA) for the shares of Qualcomm Inc. are above the price, which is a bearish sign.
The MACD line is lying below the signal line, and both are situated below the zero line, produce the red histogram that is the MACD indicator. This configuration suggests a possible market downfall.
The Qualcomm Inc. (QCOM), Relative Strength Index (RSI) line is below the SMA line which indicates a rise of a weak pattern. This further supports the idea that prices may drop in the near future.
Conclusion
In conclusion, it is advised to exercise caution before investing in the stock given the current adverse trend of Qualcomm’s stock (QCOM), the weak market structure, and the bad fundamentals. Furthermore, according to price indicators, the stock price may drop further in the near future, emphasizing the weak pattern.
Technical Levels
- Support – The current support level of Qualcomm Inc. (QCOM) is $102.
- Resistance -The current resistance level of Qualcomm Inc. (QCOM) is $132.
Disclaimer
The views and opinions of the author, or anyone named in this article, are for informational purposes only. They do not offer financial, investment, or other advice. Investing or trading crypto assets involves the risk of financial loss.




