
 Quack AI
 NEAR Protocol
 Pearl
Pearl Zcash
Zcash Quant
Quant Pudgy Penguins
 Quantus
- Goldman Sachs Group Inc. (NYSE:GS) stock price is trading below 20,50 and 100-day EMA levels.
- The stock price of Goldman Sachs Group is $326.40.
GOLDMAN SACHS GROUP (NYSE: GS) is an investment bank and financial services provider company that originated in America. Additionally, the business provides institutional and private customers with asset management and securities underwriting services.
Trend Analysis
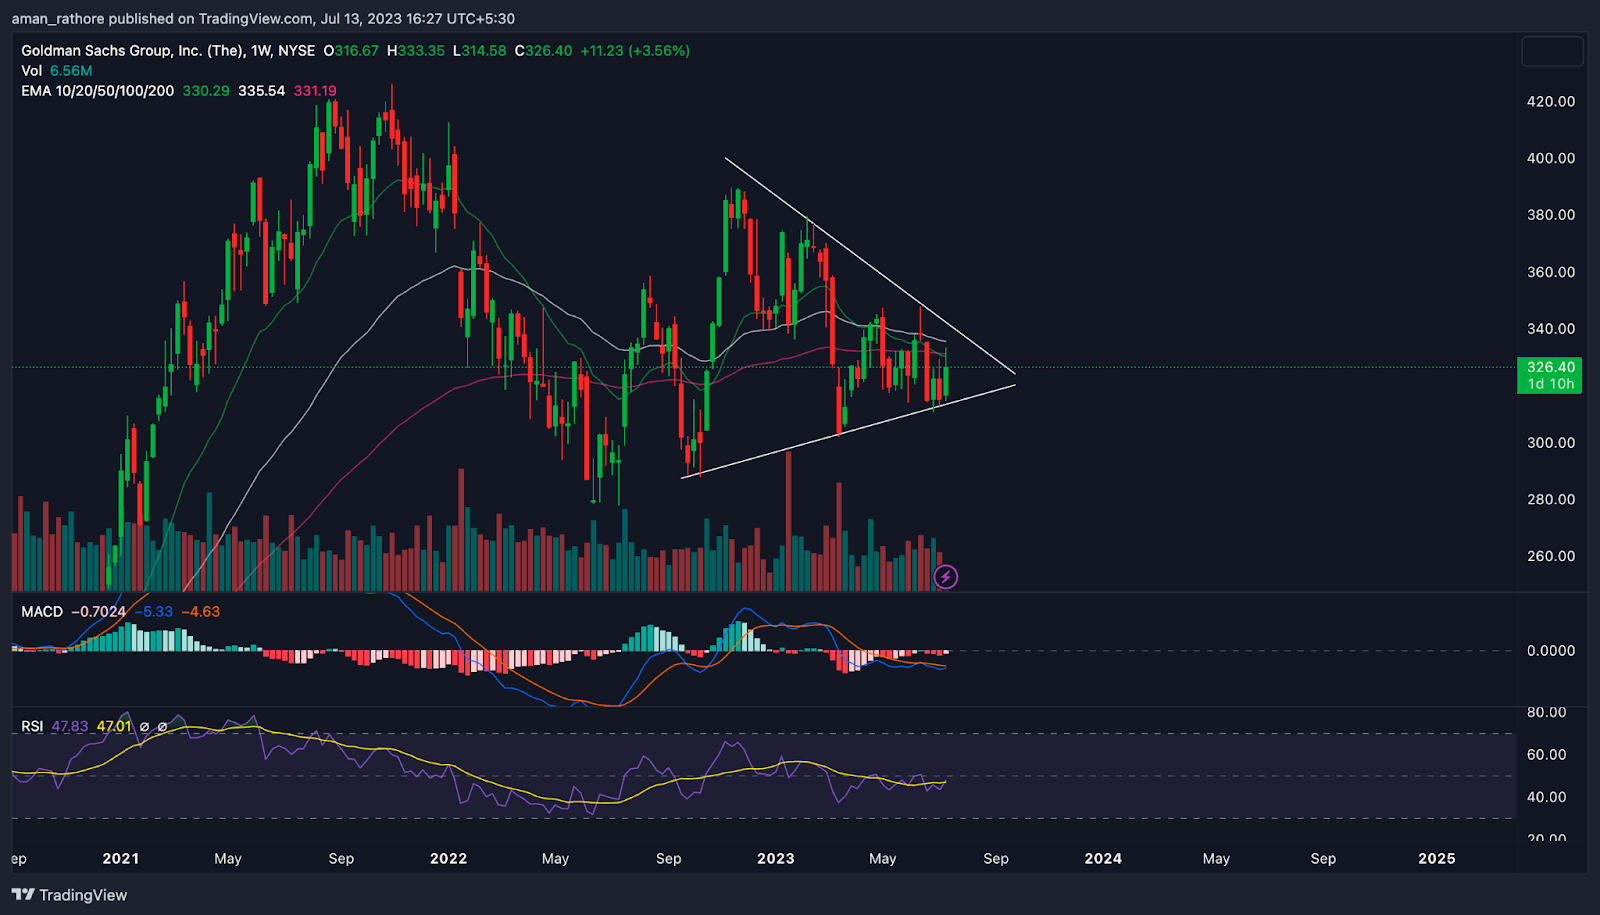
The stock price of Goldman Sachs Group Inc (NYSE: GS) is currently moving downward, according to the weekly period chart.
After reaching a peak of $426.16 in November 2021, the company entered a prior slump, and its price dropped by almost 63.4% in just seven months. At $277, Goldman Sachs Group Inc.’s stock price found support, and the downward trend soon changed. Additionally, the stock recovered 39% in just four months.
The Goldman Sachs Group stock price is at $326.40 and is close to the support level. At $342, there is resistance to the stock price. The price of the this Group is attempting to break out of a symmetrical triangular pattern in which it is currently traveling.
There are chances of a potential upward movement in the future if the price maintains above this resistance level. However, the price is forming a negative pattern.
The Goldman Sachs Group Inc. (GS) P/E ratio, in terms of its fundamentals is 8.8x, which is lower than the peer-to-peer ratio of 15x.
Goldman Sachs Group Inc. (GS)- Which Way Price Will Move?
EMA
The 20-day exponential moving average (EMA) of the closing price of GS stock is being traded below the price on a weekly basis. The 20, 50, and 200 EMAs are below the GS closing price on average. Sell-side investor confidence will rise in the near future as the share price of GS is currently declining.
MACD
On a weekly basis, Goldman Sachs Group Inc.’s MACD line is below the signal line, indicating bearish momentum. A bearish momentum is indicated by the red histogram. The price of Goldman Sachs Group Inc. is anticipated to decrease further soon.
Volume Analysis
Charts show that Goldman Sachs Group Inc.’s stock volume is steadily declining, which is a positive and reassuring sign for the downward trend in stock price. This declining volume indicates a less activity is goin on GS stock.
Conclusion
The analysis claims that Goldman Sachs Group Inc. has a deteriorating momentum and a weak market structure. Indicators like MACD, RSI, and EMA reinforce this downward trend and indicate that Goldman Sachs Group Inc.’s price may continue to fall in the future.
Technical Levels
- Support – is $311.
- Resistance – is $344.
Disclaimer
The views and opinions of the author, or anyone named in this article, are for informational purposes only. They do not offer financial, investment, or other advice. Investing or trading crypto assets involves the risk of financial loss.




