
 streamoors
 IGNITION
 Sui
Sui Quantus
 Bitcoin
 Pearl
Pearl Solana
- Procter and Gamble Company stock price is currently above the 50, and 100-day EMA levels.
- PG stock price is currently trading at $153.42.
- PG’s live market cap is $361.61 Billion.
Procter and Gamble Company (NYSE: PG) stock has a dividend payout ratio of 62.45% and the dividend yield is 2.45% per share. The stock pays a reliable dividend in every quarter year, this is a positive factor and can attract buyers’ attention.
Procter and Gamble Company (NYSE: PG) stock price is currently moving in an uptrend momentum. The stock price is forming a higher-high pattern.
Procter and Gamble Company (PG) stock has a market cap of $361.61 Billion with a revenue of $80.2 Billion which grew by 5% in FY22.
The stock has a 52-week high of $158.11 and a 52-week low of $122.18. Also, the P/E ratio of PG is 26, which denotes the stock’s price is at fair value.
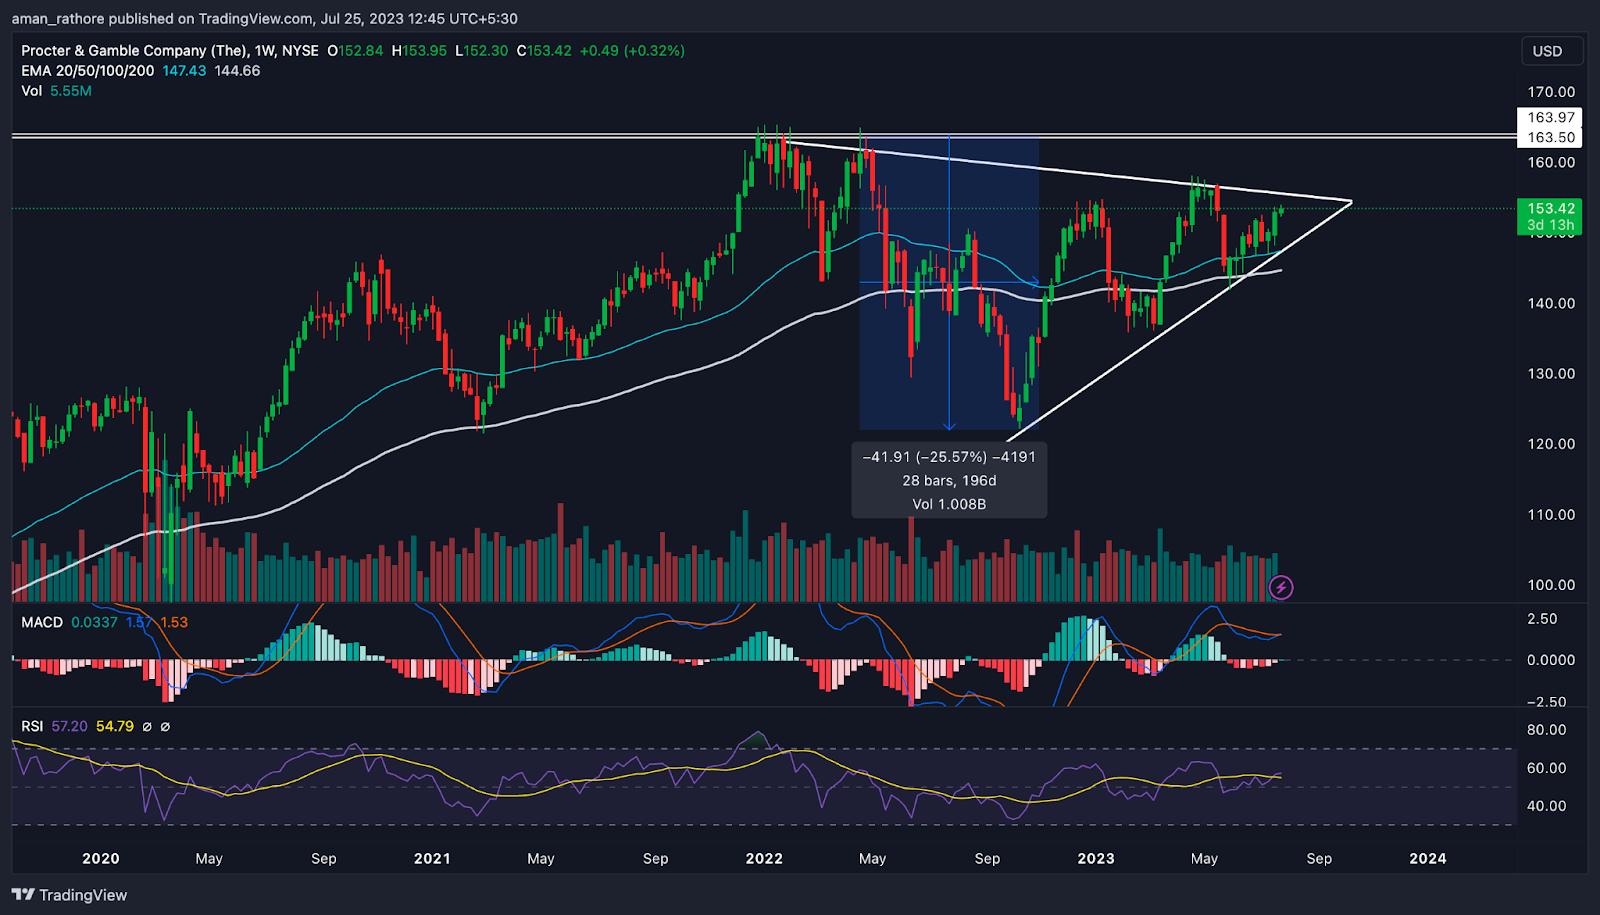
PG stock price has made a high of $164.90 in April 2022. Later, the stock price suddenly started declining. The price fell by -25% in the next six months. However, the stock found support at the $122 level and the price reversed.
After takingsupport, the price gave a recovery of around 25%. The movement of price formed a symmetrical triangle pattern. Now, the price is likely to break above the resistance level as the overall structure of the PG stock is strong and prices might shoot up.
Procter and Gamble Company (PG) Stock Price Analysis
EMA
The Procter and Gamble Company (PG) stock price is currently trading above the 50-day, and 100-day EMA levels. This indicates that the stock is positive and prices might rise in the future.
MACD
Procter and Gamble Company (PG) stock price’s MACD line is placed above the signal line, this further indicates that the stock price is positive and may face a rise in the future.
RSI
The RSI line position of the Procter and Gamble Company (PG) stock price is above the 14-day SMA line. This indicates a bullish momentum in the future.
Conclusion
As per the analysis, the Procter and Gamble Company (PG) share price is displaying a bullish pattern. There are signs that the stock price might break out above the symmetrical triangle pattern and the price might rise in the upcoming days. The indicators like RSI, MACD, and EMA are also indicating a positive momentum in the upcoming days.
Technical Levels
- Support Level– $143.
- Resistance Level– $157.
Disclaimer
The views and opinions of the author, or anyone named in this article, are for informational purposes only. They do not offer financial, investment, or other advice. Investing or trading crypto assets involves the risk of financial loss.



