
 Minter
 Quack AI
 Pearl
Pearl Monero
 The Sandbox
 Pons
Pons Bittensor
- BUD stock price surged 1.33% in the last trading session and is currently trading at $56.98.
- Anheuser-Busch InBev S.A. Share is good value based on its Price-To-Earnings Ratio (17.82x).
Anheuser-Busch InBev SA/NV makes and sells beer and beverages. It has about 500 beer brands, including Budweiser, Corona, and Stella Artois; Beck’s, Hoegaarden, Leffe, and Michelob Ultra; and Aguila, Cass, Castle, Castle Lite, Sedrin, and Skol. The company started in 1366 and is based in Leuven, Belgium.
Anheuser-Busch InBev’s share price currently trades at $56.98, inclining 1.33% in the last trading session. BUD stock holds a market cap of $97.6 Billion. It has a total of 1.73 Billion shares outstanding. The PE ratio for the stock is 17.82. The price-to-sales ratio of the stock is 1.71.
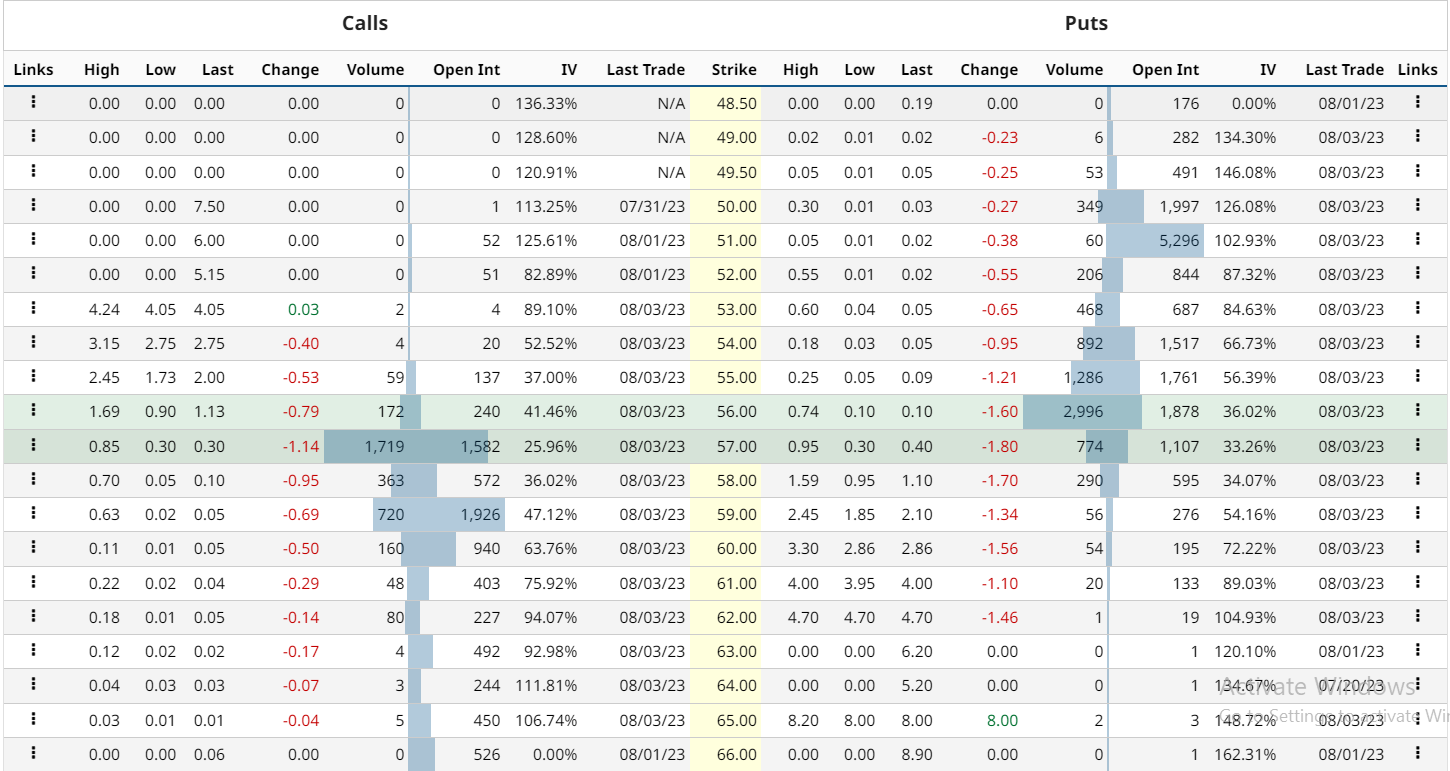
BUD stock derivatives data states that the current Implied volatility in the market is 21.70% with a decrement of 13.90% in the last trading session. It has a total of 242.7K open interest contracts as of now. The PUT/CALL ratio is 1.87 indicating a bullish sentiment coming to an end as PCR is topping out.
BUD Stock Price Prediction Using Price Action Strategy
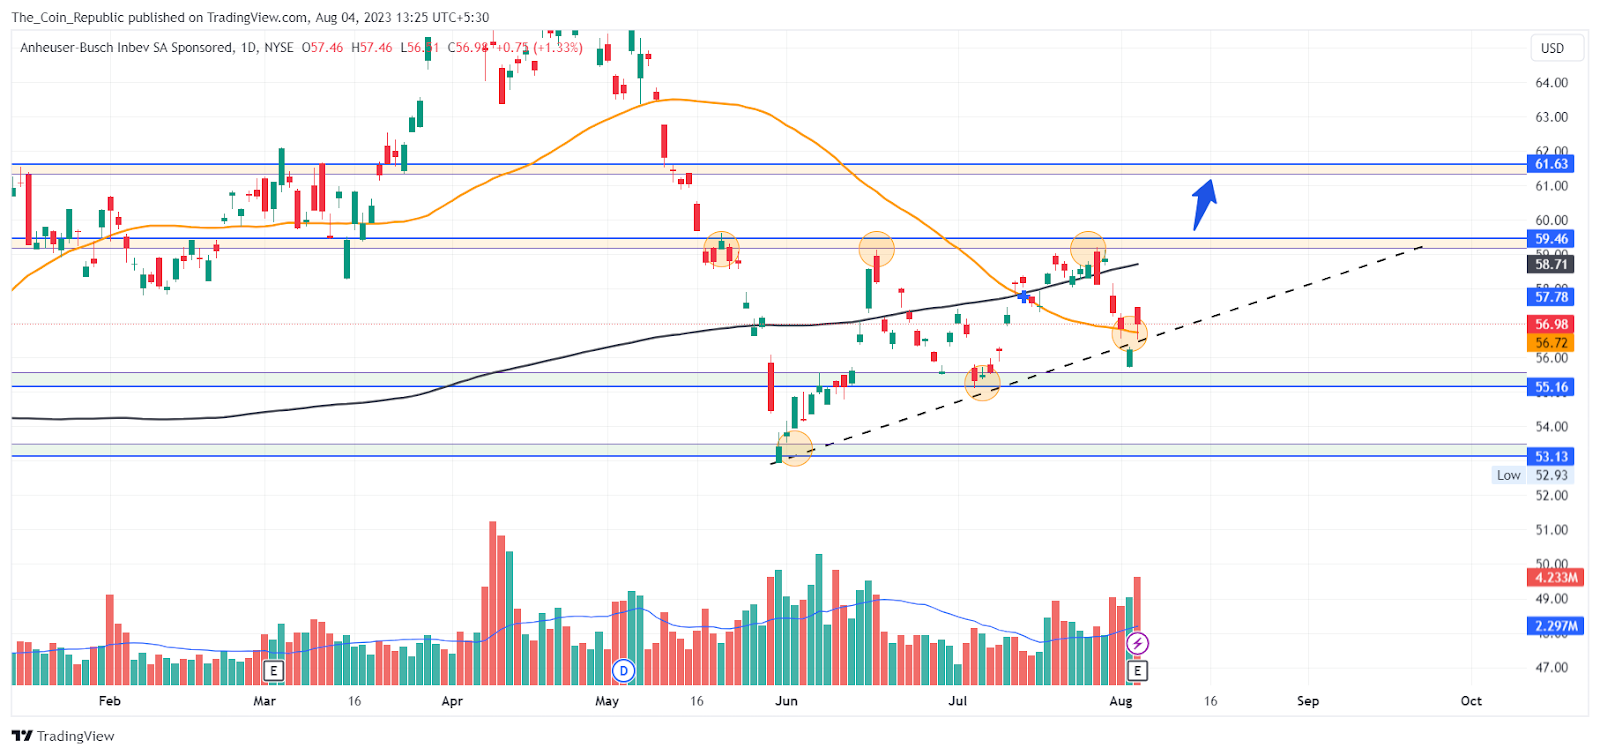
BUD share price analysis reveals that the stock was in an Advancement phase and declined nearly 20% after topping out in May 2023. Thereafter the price tried to recover but the previous support turned resistance and halted the further advancement of the price.
Currently, the price is trying to form an ascending triangle pattern by getting support from a lower trendline support and suffering rejection from an upper horizontal resistance.
Now, if the price sustains in the zone and breaks above the resistance then it may result in a shift in trend and the price may surge higher up to $61.63.
However, the current trend is downwards and the price may continue again if it fails to sustain above the trendline support.
BUD Share Price Forecast from Indicators’ point of view
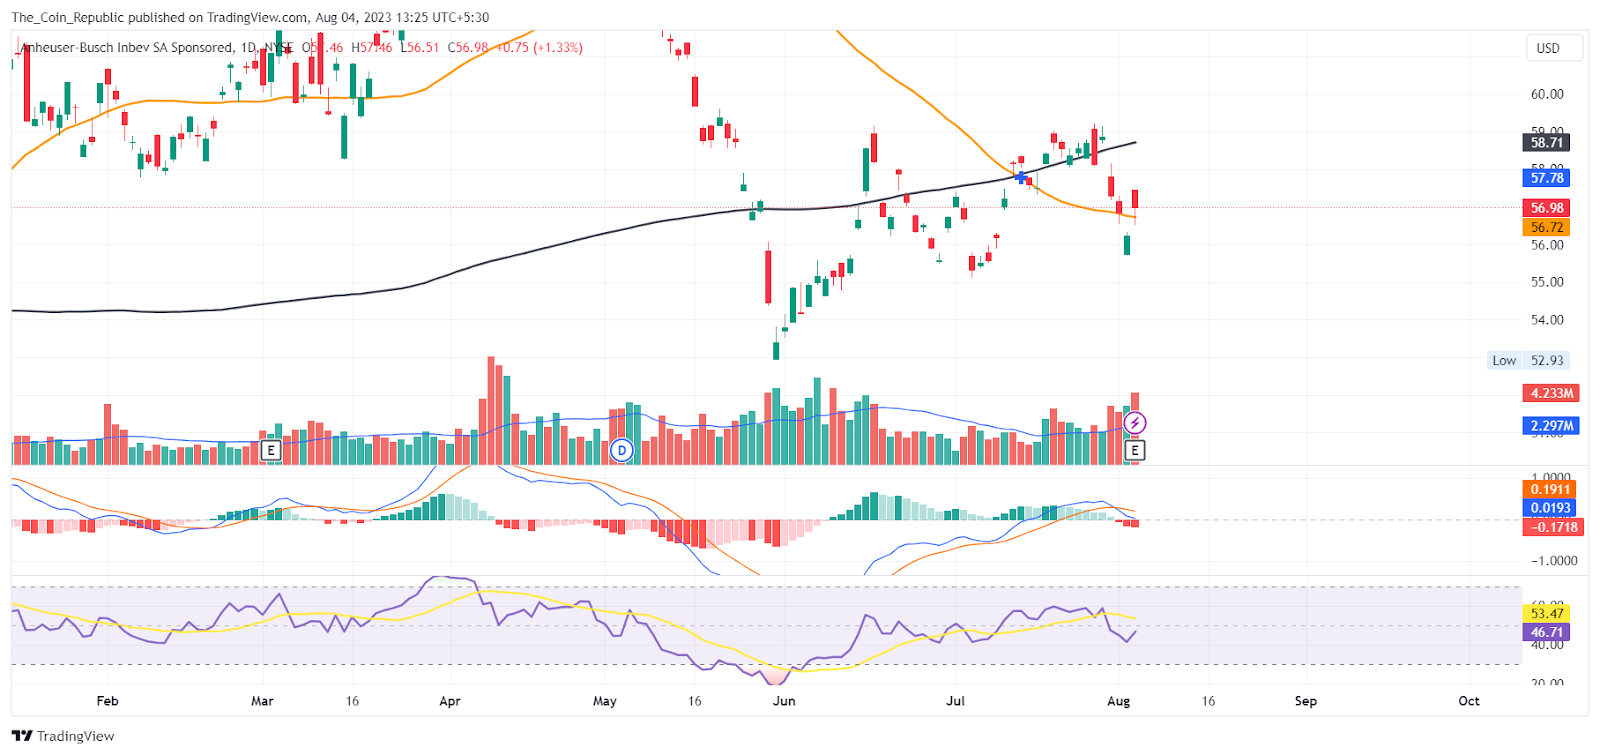
As per the EMA analysis, the BUD stock price suffered rejection from the 200 EMA and currently trying to sustain above 50 EMA. Now, the price may again surge if it gains the support of buyers from the lower levels.
At the time of publishing, the RSI value of the BUD share price is 46.71 and that of the SMA line is 53.47. RSI is headed upwards by getting support from the SMA line which shows the short-term presence of buyers in the market.
Conclusion
BUD stock price prediction concludes that the stock dropped 20% after peaking in May 2023. They tried to bounce back but faced resistance and stopped rising. The price is forming an ascending triangle pattern by getting support from a lower trendline and facing resistance from an upper horizontal line. The price may break above the resistance and change the trend and rise to $61.63.
However, the current trend is down and the price may fall again if it breaks below the support. The BUD stock price was rejected by the 200 EMA and is trying to stay above 50 EMA. The price may rise again if it gets buyers’ support from the lower levels.
Technical Levels
- Support levels: $11.94 and $10.75.
- Resistance levels: $14.02 and $14.94.
Disclaimer
The views and opinions stated by the author, or any people named in this article, are for informational purposes only and do not establish financial, investment, or other advice. Investing in or trading crypto or stock comes with a risk of financial loss.




