
 streamoors
 IGNITION
 Celestia
 Injective
 Starknet
 Pearl
Pearl Quantus
- NEXO/USD is inside a range with a breakout incoming anytime.
- The price is below 200 EMA indicating a bearish trend.
The native token of the Nexo cryptocurrency trading and lending platform, which is interoperable with both ERC-20 and BEP-2, is called the NEXO Token. The This Token offers various benefits to users, including higher returns on digital assets, free crypto rewards on card purchases, and interest rate reductions on credit lines backed by cryptocurrencies. The platform provides users with the ability to buy, sell, trade, and borrow money using cryptocurrencies, creating a comprehensive crypto finance ecosystem. The latest addition to the platform is the Card, the world’s first cryptocurrency-backed card.
Analyzing the price of NEXO
Weekly chart
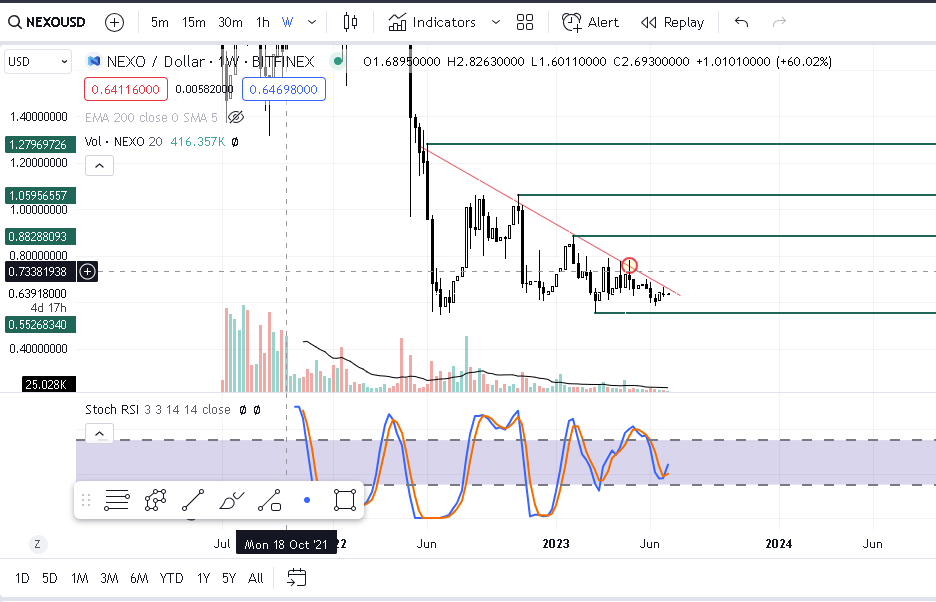
Upon analyzing the weekly chart, we observe that the NEXO relative strength index (RSI) is in the middle, confusing both buyers and sellers about the market’s direction. Furthermore, the price is gradually squeez within a trend line. There was a breakout but it failed (marked by a circle). It is worth noting that the price squeeze is not a result of the regular market cycle but rather a decrease in trading volume, occasionally dropping as low as 10k. Apart from that, an up rally can be seen (if supported by volume) by the trend line break and targets can be at $0.88288093, $1.0596557, and $1.27969726. Conversely, a breakdown below $0.55268340 would indicate a continuation of the downtrend.
Daily chart
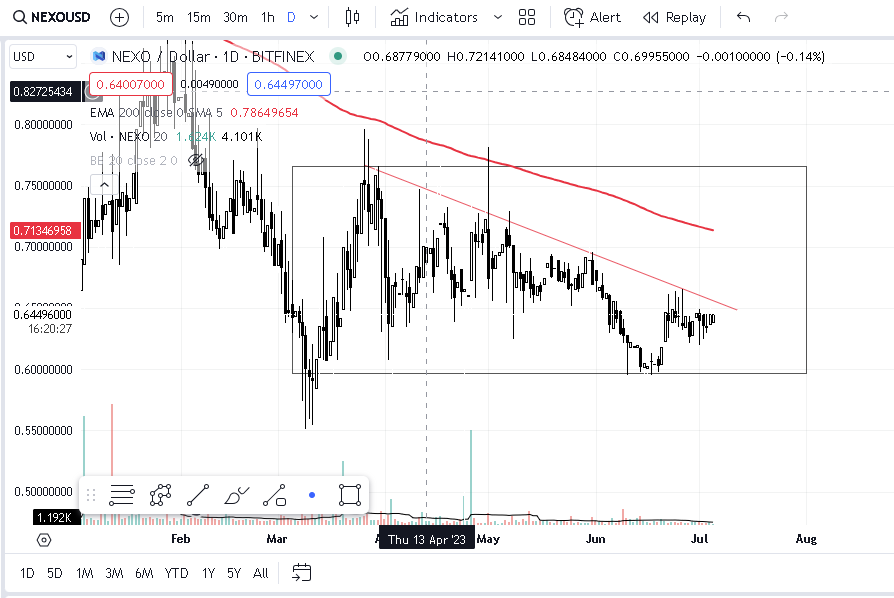
The daily chart shows that the market is currently trading within a range. The price is below the 200-day exponential moving average (EMA), indicating a bearish trend. Momentum on either side could result in a breakout within the range, provided there is sufficient volume. Going long for the entire month of August also coincides with the breakout in 200 ema from below. The ends of the range are:
Upper end: $0.76598480
Lower end: $0.60000000
Conclusion
The NEXO/USD coin is currently experiencing a decrease in trading volume.. However, once the volume picks up, one can expect trending moves on either side of the range (daily chart). Predicting the exact price of NEXO is somewhat difficult due to various circumstances. The world of crypto is very volatile and the fundamentals of a coin cannot trusted for a longer period of time.
Disclaimer
The information on this document is provided for information purpose only. It does not constitute any offer, recommendation or solicitation to any person to enter into any transaction or adopt any hedging.




