
 Boomer
 Pearl
Pearl Covenant x402
 Claudia
 Bitcoin
 hi
hi NEAR Protocol
- HBR stock price is currently trading at $255.2.
- HBR’s price is currently at a major support level of $216.7.
Harbour Energy plc, established in 1934, is a notable player in the oil and gas sector. The company specializes in various aspects of the industry. The acquisition and exploration to the development and production of oil and gas resources. With focus on operations in both the North Sea and international markets. Harbour Energy plays a significant role in the energy landscape.
A noteworthy development unfolded on July 31, 2023, when the British Government unveiled plans to grant numerous licenses for oil and gas extraction in the North Sea. This initiative is aimed at achieving energy independence and includes provisions for potential future licenses as well. The government also expressed its commitment to supporting carbon capture and storage (CSS) clusters in regions such as Scotland and northern England.
This strategic move has garnered positive reactions from various energy entities, including SHEL and Harbour, who are key partners in the Acron CSS project. Notably, the Acron CSS project has received the coveted Track 2 status, enhancing its potential impact and importance. In addition, Harbour’s CSS project, designed to store carbon dioxide in depleted gas fields, has also earned Track 2 Status. These developments hold the promise of significant gains for Harbour Energy Plc in the foreseeable future, positioning the company favorably within the evolving energy landscape.
Harbour Energy Plc’s Potential Beyond its Current Support Level
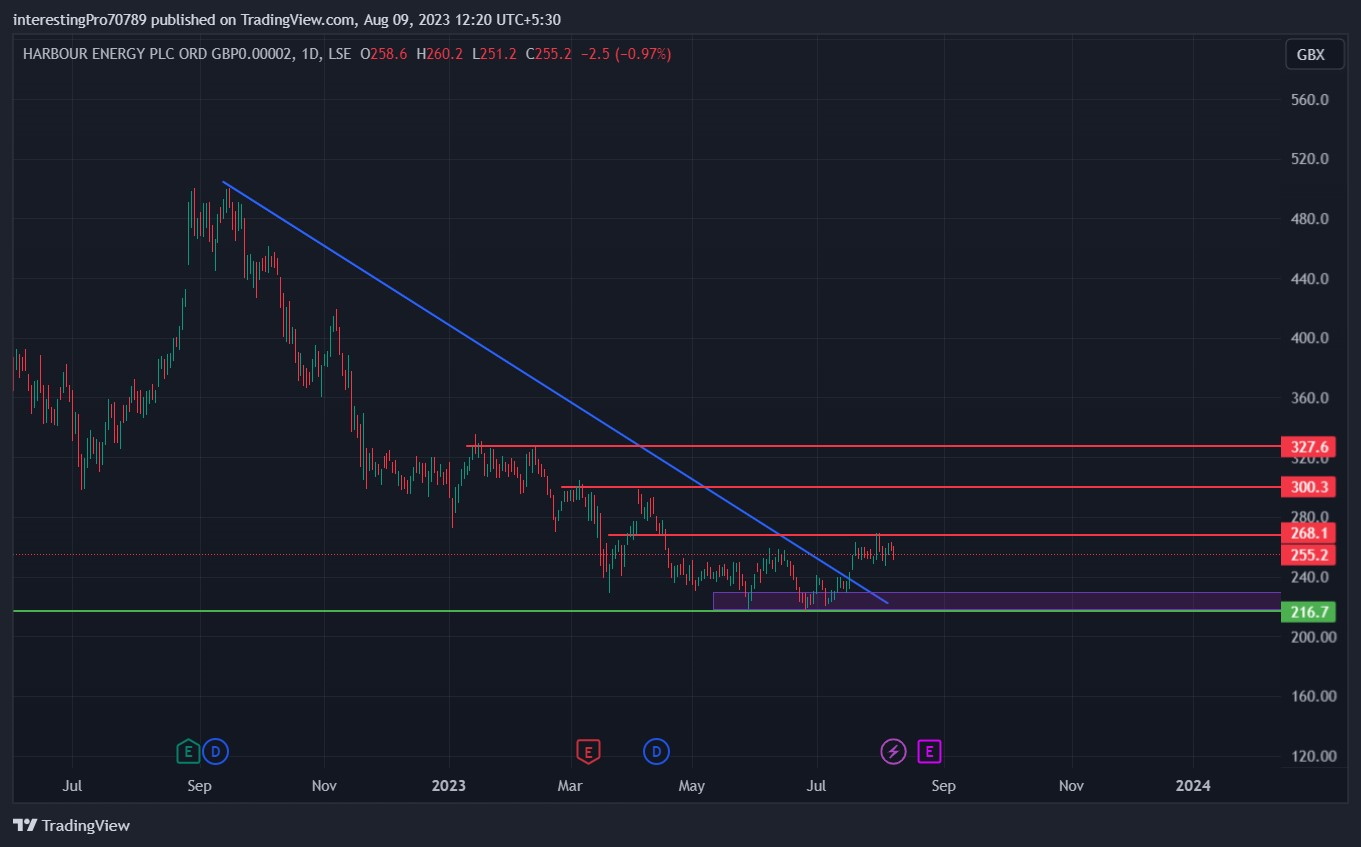
From August 2022 to June 2023, Harbour Energy plc (HBR) experienced a notable decline, with its stock price decreasing by more than 45%. During this decline, the stock found support at the $216.7 level, which has since become a crucial foundation. Recent price action also revealed a break of the downward trendline originating from higher levels, while encountering resistance around the $268 mark.
Given the prolonged duration of HBR’s downtrend, a swift and complete recovery (V-shaped) is an uncommon occurrence in the market. Instead, the stock seems to be establishing a consolidation phase within the range of $216.7 to $268. This suggests that the price needs to solidify its base of support to potentially gather substantial bullish momentum for the future.
A breakout beyond the $268 resistance level could trigger a notable upward movement. If this occurs, the next immediate resistance lies at $300, followed by a further obstacle at the $327.6 resistance level. However, it’s important to note that market dynamics and trends rarely reverse abruptly, and a sturdy support foundation is vital for sustained upward momentum.
Technical Indicators prediction about the current trend
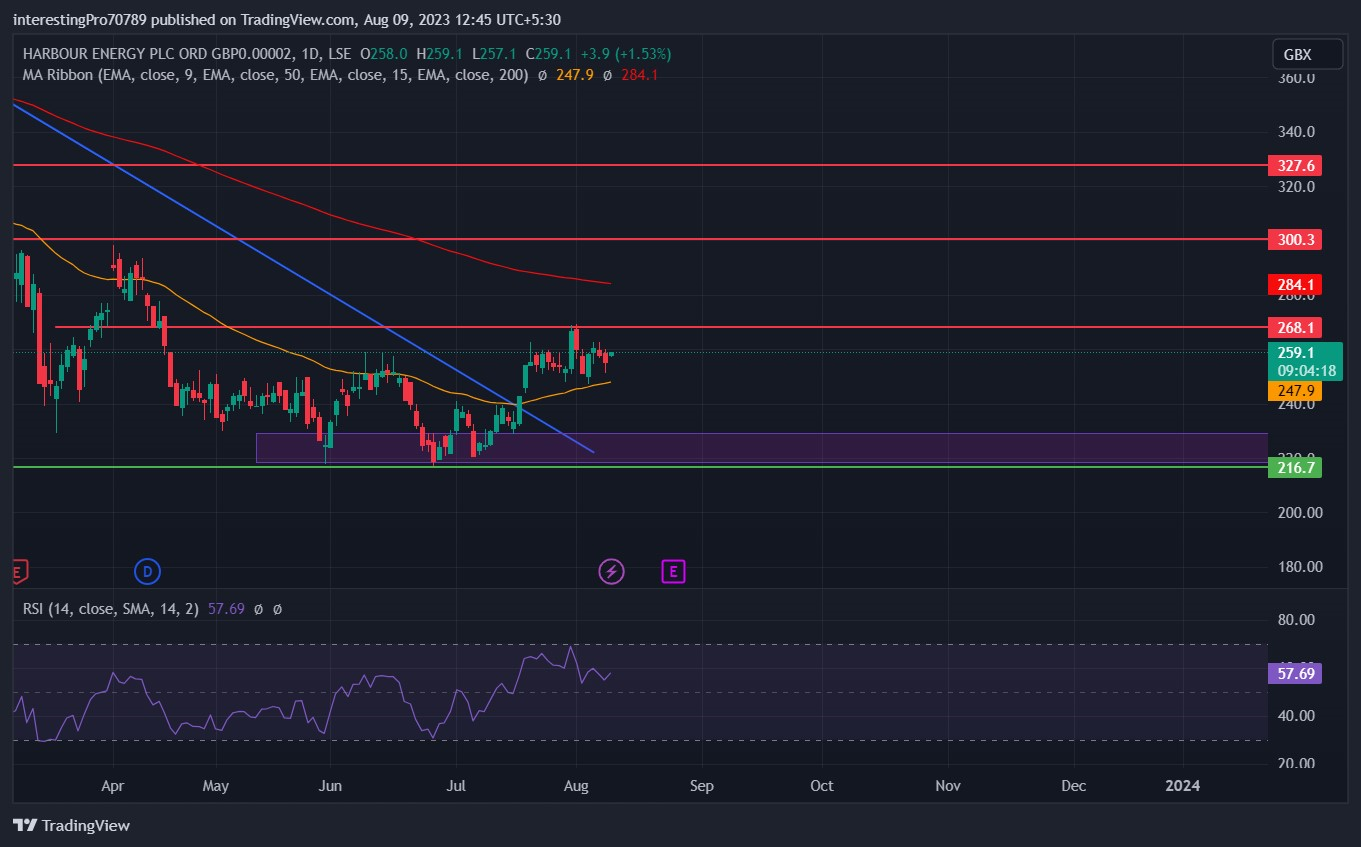
Also, the Exponential Moving Averages (EMAs) offer valuable insights into Harbour Energy plc’s (HBR) current price dynamics. The 50 EMA (yellow line) at $247.4 suggests a potential bullish sentiment, indicating a positive momentum. Conversely, the 200 EMA (red line) at $284.4 indicates that the price could face selling pressure, pointing towards a possible bearish trend. The fact that the price is trading between these EMAs reflects an ongoing indecisive market sentiment. This scenario is often associated with a consolidation phase, where the price is neither distinctly bullish nor bearish.
A noteworthy aspect to monitor is the potential for a crossover of the EMAs. If the 50 EMA surpasses the 200 EMA, indicating a bullish crossover, and the price closes above the 200 EMA, it could signify the beginning of a bullish momentum for HBR stocks. However, until this potential crossover materializes, the price may remain within a consolidation phase, demonstrating the need for further clarity in market direction.
The relative strength index (RSI) currently stands at 54.86, positioning it within neutral territory. This implies balanced struggle between buyers and sellers, indicating that the price of HBR stock is currently undergoing consolidation phase.
Conclusion
In conclusion,Harbour Energy plc (HBR) stock is exhibiting characteristics of an indecisive phase, with the price trapped within a consolidation zone. This consolidation is potentially positive for future bullish momentum, as it signifies the price forming a strong base of support. The indicators mentioned earlier, including EMAs and RSI, reinforce this notion by pointing towards a period of consolidation or neutrality.
Importantly, the consolidation phase suggests that market participants are assessing. The stock’s direction before committing to a clear trend. This can provide an opportunity for price to gather momentum and potentially break out in an upward direction.
Considering fundamental news surrounding HBR, it’s worth noting that positive developments can play a significant role in influencing the stock’s future price trajectory.
Technical levels
Resistance levels: $268, $300 and $327.6
Support levels: $216.7
Disclaimer
The views and opinions stated by the author, or any people named in this article, are for informational purposes only. They do not establish financial, investment, or other advice. Investing in or trading crypto assets comes with a risk of financial loss.




